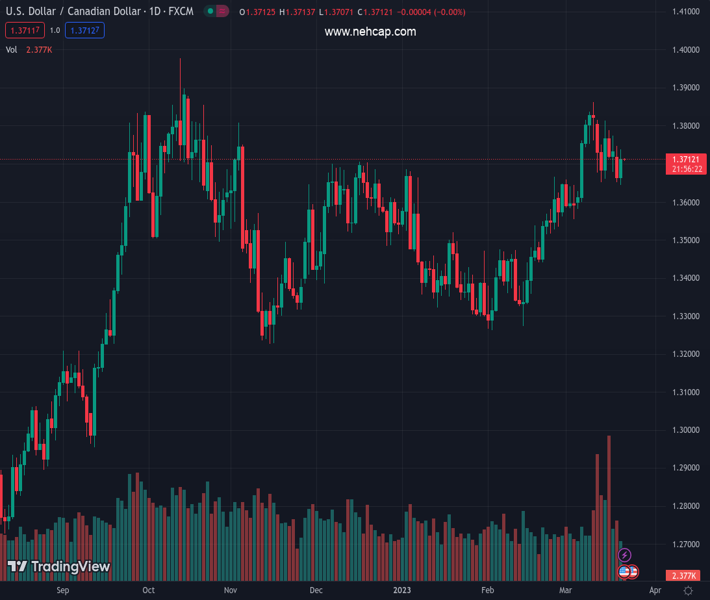
#USDCAD @ 1.37124 struggles to defend the bounce off two-week low inside short-term triangle., @nehcap view: Further upside expected (Pivot Orderbook analysis)
…
This is a premium post.
[s2If !current_user_can(access_s2member_level4)]Please register for PREMIUM VERSION HERE to read full post below containing analysis. In case of any error or you think you are not able to read the full post below, please email us at support#nehcap.com [lwa][/s2If] [s2If current_user_can(access_s2member_level4)]
- USD/CAD struggles to defend the bounce off two-week low inside short-term triangle.
- Convergence of 50-SMA, triangle’s top line challenge Loonie pair buyers.
- Bears have a bumpy road to travel before retaking control.
- Sustained trading beyond key SMA, bullish chart pattern and absence of momentum-negative oscillators favor buyers.
The pair currently trades last at 1.37124.
The previous day high was 1.3747 while the previous day low was 1.3652. The daily 38.2% Fib levels comes at 1.3688, expected to provide support. Similarly, the daily 61.8% fib level is at 1.3711, expected to provide support.
USD/CAD grinds near 1.3715-20 as it resists welcoming bulls during the initial hours of the Federal Reserve (Fed) day. In doing so, the Loonie pair struggles to extend the previous day’s recovery moves from the lowest levels in a fortnight inside a two-week-old descending triangle formation.
That said, the quote’s latest hesitance could be linked to the failure to cross the 1.3730 resistance confluence including the 50-SMA and upper line of the stated triangle.
However, the Loonie pair’s ability to provide successful trading above the key SMAs joins the bullish MACD signals and firmer RSI (14), not overbought, keeps the USD/CAD bulls hopeful of overcoming the 1.3730 hurdle.
In that case, the buyers could aim for the monthly high surrounding 1.3865, with the 1.3800 round figure acting as an intermediate halt, before portraying a run-up towards the previous yearly top of 1.3977 and then to the 1.4000 psychological magnet.
On the flip side, the USD/CAD bears need validation from the stated triangle’s lower line, close to 1.3650. Even so, the 200-SMA support near 1.3575 appears a crucial challenge for the sellers to tackle. It’s worth noting that the 100-SMA can offer immediate support near 1.3695.
Overall, USD/CAD is likely to remain firmer but the immediate pullback can’t be ruled out.
Trend: Further upside expected
Technical Levels: Supports and Resistances
USDCAD currently trading at 1.3713 at the time of writing. Pair opened at 1.3664 and is trading with a change of 0.36% % .
| Overview | Overview.1 | |
|---|---|---|
| 0 | Today last price | 1.3713 |
| 1 | Today Daily Change | 0.0049 |
| 2 | Today Daily Change % | 0.36% |
| 3 | Today daily open | 1.3664 |
The pair remains strongly bullish on the daily timeframe. It trades above its 20 SMA @ 1.3669, 50 SMA 1.3503, 100 SMA @ 1.351 and 200 SMA @ 1.3344.
| Trends | Trends.1 | |
|---|---|---|
| 0 | Daily SMA20 | 1.3669 |
| 1 | Daily SMA50 | 1.3503 |
| 2 | Daily SMA100 | 1.3510 |
| 3 | Daily SMA200 | 1.3344 |
The previous day high was 1.3747 while the previous day low was 1.3652. The daily 38.2% Fib levels comes at 1.3688, expected to provide support. Similarly, the daily 61.8% fib level is at 1.3711, expected to provide support.
Note the levels of interest below:
- Pivot support is noted at 1.3628, 1.3592, 1.3533
- Pivot resistance is noted at 1.3724, 1.3783, 1.3819
| Levels | Levels.1 |
|---|---|
| Previous Daily High | 1.3747 |
| Previous Daily Low | 1.3652 |
| Previous Weekly High | 1.3828 |
| Previous Weekly Low | 1.3652 |
| Previous Monthly High | 1.3666 |
| Previous Monthly Low | 1.3262 |
| Daily Fibonacci 38.2% | 1.3688 |
| Daily Fibonacci 61.8% | 1.3711 |
| Daily Pivot Point S1 | 1.3628 |
| Daily Pivot Point S2 | 1.3592 |
| Daily Pivot Point S3 | 1.3533 |
| Daily Pivot Point R1 | 1.3724 |
| Daily Pivot Point R2 | 1.3783 |
| Daily Pivot Point R3 | 1.3819 |
[/s2If]
Join Our Telegram Group
")


