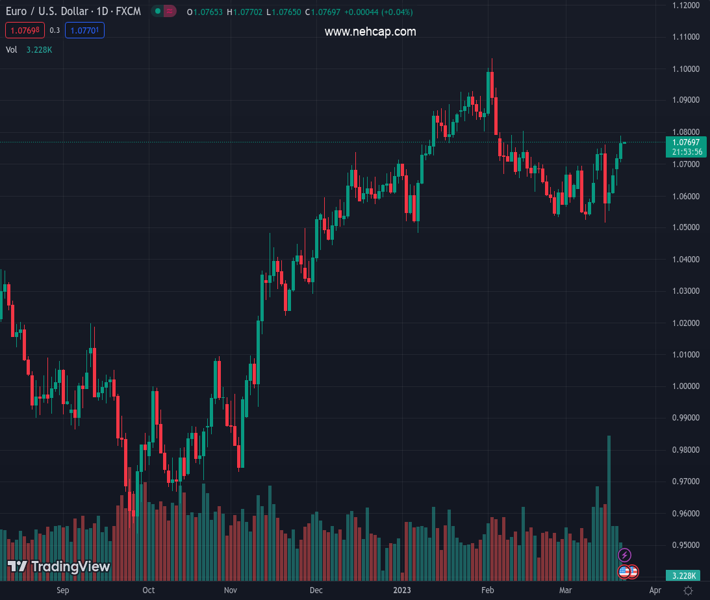
#EURUSD @ 1.07692 is juggling around 1.0780, gathering strength for a fresh upside. (Pivot Orderbook analysis)
…
This is a premium post.
[s2If !current_user_can(access_s2member_level4)]Please register for PREMIUM VERSION HERE to read full post below containing analysis. In case of any error or you think you are not able to read the full post below, please email us at support#nehcap.com [lwa][/s2If] [s2If current_user_can(access_s2member_level4)]
- EUR/USD is juggling around 1.0780, gathering strength for a fresh upside.
- Odds are favoring that the Fed would go for hiking rates despite knowing the banking sector debacle.
- Eurozone-ZEW Survey dropped to 10.0 after a five-month rising spell.
The pair currently trades last at 1.07692.
The previous day high was 1.0731 while the previous day low was 1.0631. The daily 38.2% Fib levels comes at 1.0693, expected to provide support. Similarly, the daily 61.8% fib level is at 1.0669, expected to provide support.
The EUR/USD pair has turned sideways in the early Tokyo session after printing a fresh five-week high at 1.0788 on Tuesday. The major currency pair has been underpinned despite the odds favoring a 25 basis point (bp) rate hike by the Federal Reserve (Fed). As per the CME Fedwatch tool, more than 87% chances are in favor of a 25 bps rate hike, which would push rates to 4.75-5.00%.
The context that has spooked the market’s sentiment is that Fed chair Jerome Powell would go for hiking rates despite knowing the banking sector debacle whose consequences are yet to be faced ahead.
Meanwhile, a two-day winning spell by S&P500 has shown that the market is trying hard to revive itself from the banking sector shakedown. The risk appetite theme has also weighed on the US Dollar Index (DXY). The USD Index looks vulnerable above 103.00 and is prone to further downside.
On the Eurozone front, the banking sector debacle has hurt the sentiment of the market participants. Eurozone-ZEW Survey that considers the sentiment of institutional investors dropped to 10.0 after a five-month rising spell.
EUR/USD is struggling to extend the 50% Fibonacci retracement (placed from February 01 high at 1.1033 to March 15 low at 1.0516) at 1.0776 on a four-hour scale. Usually, a perpendicular rally in an asset is followed by a mean reversion to near the 20-period Exponential Moving Average (EMA), which is hovering around 1.0711, at the time of writing.
The Relative Strength Index (RSI) (14) is oscillating in the bullish range of 60.00-80.00, which indicates that the upside momentum is active.
For further upside, the shared currency pair needs to surpass the immediate resistance plotted from January 20 low at 1.0802, which will drive the asset toward January 18 high at 1.0887 and the round-level resistance at 1.0900.
On the flip side, a downside break below March 17 low at 1.0612 would drag the shared currency pair toward March 16 low at 1.0551, followed by March 15 low at 1.0516.
Technical Levels: Supports and Resistances
EURUSD currently trading at 1.0769 at the time of writing. Pair opened at 1.072 and is trading with a change of 0.46 % .
| Overview | Overview.1 | |
|---|---|---|
| 0 | Today last price | 1.0769 |
| 1 | Today Daily Change | 0.0049 |
| 2 | Today Daily Change % | 0.4600 |
| 3 | Today daily open | 1.0720 |
The pair remains strongly bullish on the daily timeframe. It trades above its 20 SMA @ 1.0626, 50 SMA 1.0728, 100 SMA @ 1.0577 and 200 SMA @ 1.0327.
| Trends | Trends.1 | |
|---|---|---|
| 0 | Daily SMA20 | 1.0626 |
| 1 | Daily SMA50 | 1.0728 |
| 2 | Daily SMA100 | 1.0577 |
| 3 | Daily SMA200 | 1.0327 |
The previous day high was 1.0731 while the previous day low was 1.0631. The daily 38.2% Fib levels comes at 1.0693, expected to provide support. Similarly, the daily 61.8% fib level is at 1.0669, expected to provide support.
Note the levels of interest below:
- Pivot support is noted at 1.0658, 1.0595, 1.0558
- Pivot resistance is noted at 1.0757, 1.0794, 1.0857
| Levels | Levels.1 |
|---|---|
| Previous Daily High | 1.0731 |
| Previous Daily Low | 1.0631 |
| Previous Weekly High | 1.0760 |
| Previous Weekly Low | 1.0516 |
| Previous Monthly High | 1.1033 |
| Previous Monthly Low | 1.0533 |
| Daily Fibonacci 38.2% | 1.0693 |
| Daily Fibonacci 61.8% | 1.0669 |
| Daily Pivot Point S1 | 1.0658 |
| Daily Pivot Point S2 | 1.0595 |
| Daily Pivot Point S3 | 1.0558 |
| Daily Pivot Point R1 | 1.0757 |
| Daily Pivot Point R2 | 1.0794 |
| Daily Pivot Point R3 | 1.0857 |
[/s2If]
Join Our Telegram Group
")


