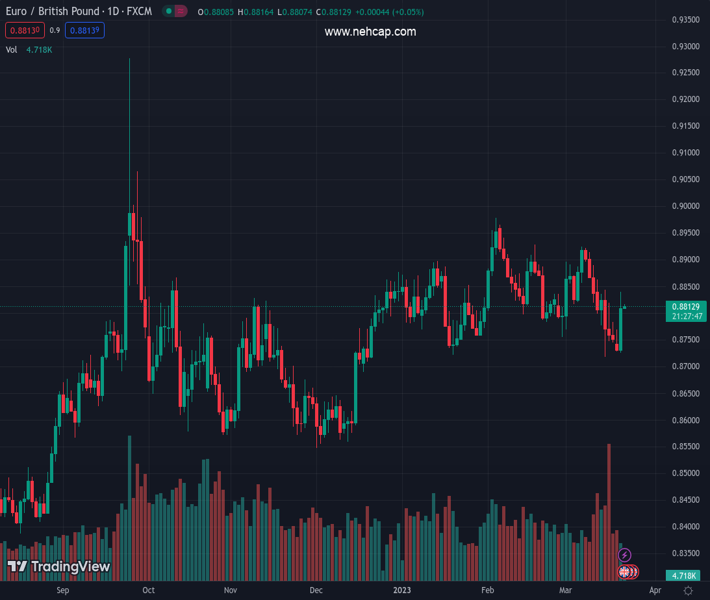
#EURGBP @ 0.88130 retreats from the key EMA convergence after rising the most in three months., @nehcap view: Further upside expected (Pivot Orderbook analysis)
…
This is a premium post.
[s2If !current_user_can(access_s2member_level4)]Please register for PREMIUM VERSION HERE to read full post below containing analysis. In case of any error or you think you are not able to read the full post below, please email us at support#nehcap.com [lwa][/s2If] [s2If current_user_can(access_s2member_level4)]
- EUR/GBP retreats from the key EMA convergence after rising the most in three months.
- Steady RSI, easing bearish MACD signals keep buyers hopeful backed by a clear upside break of two-week-old trend line.
- 200-EMA, 61.8% Fibonacci retracement constitutes strong support to challenge bears.
The pair currently trades last at 0.88130.
The previous day high was 0.8773 while the previous day low was 0.8728. The daily 38.2% Fib levels comes at 0.8745, expected to provide support. Similarly, the daily 61.8% fib level is at 0.8756, expected to provide support.
EUR/GBP treads water around 0.8810-15, after rising the most in three months, as it braces for the key UK data/events during early Wednesday.
In doing so, the cross-currency pair retreats from the convergence of the 21-day and 50-day Exponential Moving Average (EMA).
However, the recent easing in the bearish bias of the MACD signals and steady RSI joins the EUR/GBP pair’s successful break of a two-week-old descending trend line keep the buyers hopeful of crossing the 0.8820 resistance confluence.
Following that, a run-up towards the 0.8900 round figure can’t be ruled out.
However, a downward-sloping resistance line from mid-February, around 0.8920 by the press time, could challenge the EUR/GBP bulls afterward.
On the contrary, pullback moves gain importance if breaking the previous resistance line, around 0.8765 at the latest.
Trend: Further upside expected
Technical Levels: Supports and Resistances
EURGBP currently trading at 0.8813 at the time of writing. Pair opened at 0.8733 and is trading with a change of 0.92 % .
| Overview | Overview.1 | |
|---|---|---|
| 0 | Today last price | 0.8813 |
| 1 | Today Daily Change | 0.0080 |
| 2 | Today Daily Change % | 0.9200 |
| 3 | Today daily open | 0.8733 |
The pair is trading below its 20 Daily moving average @ 0.8826, below its 50 Daily moving average @ 0.8836 , above its 100 Daily moving average @ 0.8773 and above its 200 Daily moving average @ 0.8685
| Trends | Trends.1 | |
|---|---|---|
| 0 | Daily SMA20 | 0.8826 |
| 1 | Daily SMA50 | 0.8836 |
| 2 | Daily SMA100 | 0.8773 |
| 3 | Daily SMA200 | 0.8685 |
The previous day high was 0.8773 while the previous day low was 0.8728. The daily 38.2% Fib levels comes at 0.8745, expected to provide support. Similarly, the daily 61.8% fib level is at 0.8756, expected to provide support.
Note the levels of interest below:
- Pivot support is noted at 0.8717, 0.87, 0.8672
- Pivot resistance is noted at 0.8761, 0.8789, 0.8806
| Levels | Levels.1 |
|---|---|
| Previous Daily High | 0.8773 |
| Previous Daily Low | 0.8728 |
| Previous Weekly High | 0.8864 |
| Previous Weekly Low | 0.8718 |
| Previous Monthly High | 0.8979 |
| Previous Monthly Low | 0.8755 |
| Daily Fibonacci 38.2% | 0.8745 |
| Daily Fibonacci 61.8% | 0.8756 |
| Daily Pivot Point S1 | 0.8717 |
| Daily Pivot Point S2 | 0.8700 |
| Daily Pivot Point S3 | 0.8672 |
| Daily Pivot Point R1 | 0.8761 |
| Daily Pivot Point R2 | 0.8789 |
| Daily Pivot Point R3 | 0.8806 |
[/s2If]
Join Our Telegram Group
")


