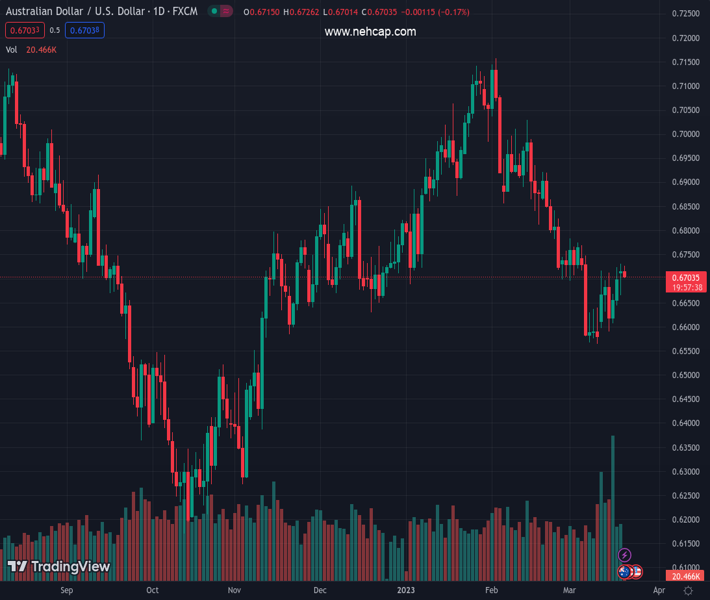
#AUDUSD @ 0.67033 has slipped firmly to near 0.6700 as RBA considered only 25 bps a viable option for March’s monetary policy. (Pivot Orderbook analysis)
…
This is a premium post.
[s2If !current_user_can(access_s2member_level4)]Please register for PREMIUM VERSION HERE to read full post below containing analysis. In case of any error or you think you are not able to read the full post below, please email us at support#nehcap.com [lwa][/s2If] [s2If current_user_can(access_s2member_level4)]
- AUD/USD has slipped firmly to near 0.6700 as RBA considered only 25 bps a viable option for March’s monetary policy.
- Recent upbeat Australian employment figures have conveyed that the fight against sticky inflation is extremely complicated.
- After the collapse of three mid-size US commercial banks, Fed is required to revive the confidence of investors.
The pair currently trades last at 0.67033.
The previous day high was 0.673 while the previous day low was 0.6666. The daily 38.2% Fib levels comes at 0.6706, expected to provide resistance. Similarly, the daily 61.8% fib level is at 0.669, expected to provide support.
The AUD/USD pair has slipped to near 0.6705 amid the release of the less hawkish Reserve Bank of Australia (RBA) minutes. The Board reiterated that further tightening of the POLICY would likely be required given inflation was still too high, the labor market tight and business surveys showed solid activity. RBA policymakers considered only a 25 basis points (bps) rate hike as a viable option for March’s monetary policy.
Investors should be aware of the fact that RBA Governor Philip Lowe hiked its Official Cash Rate (OCR) by 25 bps consecutively for the fifth time to 3.60%. Also, it was the 10th consecutive interest rate hike by the RBA in its battle against stubborn inflation.
Recent upbeat Australian employment figures have conveyed that the fight against sticky inflation is extremely complicated and RBA policymakers are still required to take tough decisions in times when inflation uncertainty has joined fears of a global banking meltdown.
S&P500 futures have extended Monday’s gains in the Asian session as investors have ignored the fears associated with upcoming monetary policy by the Federal Reserve (Fed), portraying further enhancement in the risk appetite of the market participants.
The US Dollar Index (DXY) has continued to remain sideways around 103.30 as investors are anticipating a less hawkish monetary policy and interest rate guidance. After the collapse of three mid-size United States commercial banks, Fed chair Jerome Powell is required to revive the confidence of investors, which could be done by mild tweaks to the interest rate policy.
Meanwhile, the demand for US government bonds has weakened further as the collaborative effort of various central banks of providing liquidity assistance in the form of US Dollars for supporting commercial banks has escalated inflation expectations. This has led to a rise in the returns offers on US Treasury bonds. The 10-year US Treasury yields have jumped to 3.5%.
Technical Levels: Supports and Resistances
AUDUSD currently trading at 0.6712 at the time of writing. Pair opened at 0.6719 and is trading with a change of -0.1 % .
| Overview | Overview.1 | |
|---|---|---|
| 0 | Today last price | 0.6712 |
| 1 | Today Daily Change | -0.0007 |
| 2 | Today Daily Change % | -0.1000 |
| 3 | Today daily open | 0.6719 |
The pair is trading above its 20 Daily moving average @ 0.6702, below its 50 Daily moving average @ 0.6867 , below its 100 Daily moving average @ 0.6781 and below its 200 Daily moving average @ 0.6764
| Trends | Trends.1 | |
|---|---|---|
| 0 | Daily SMA20 | 0.6702 |
| 1 | Daily SMA50 | 0.6867 |
| 2 | Daily SMA100 | 0.6781 |
| 3 | Daily SMA200 | 0.6764 |
The previous day high was 0.673 while the previous day low was 0.6666. The daily 38.2% Fib levels comes at 0.6706, expected to provide resistance. Similarly, the daily 61.8% fib level is at 0.669, expected to provide support.
Note the levels of interest below:
- Pivot support is noted at 0.668, 0.6641, 0.6616
- Pivot resistance is noted at 0.6744, 0.6769, 0.6808
| Levels | Levels.1 |
|---|---|
| Previous Daily High | 0.6730 |
| Previous Daily Low | 0.6666 |
| Previous Weekly High | 0.6725 |
| Previous Weekly Low | 0.6579 |
| Previous Monthly High | 0.7158 |
| Previous Monthly Low | 0.6698 |
| Daily Fibonacci 38.2% | 0.6706 |
| Daily Fibonacci 61.8% | 0.6690 |
| Daily Pivot Point S1 | 0.6680 |
| Daily Pivot Point S2 | 0.6641 |
| Daily Pivot Point S3 | 0.6616 |
| Daily Pivot Point R1 | 0.6744 |
| Daily Pivot Point R2 | 0.6769 |
| Daily Pivot Point R3 | 0.6808 |
[/s2If]
Join Our Telegram Group
")


