#AUDUSD @ 0.66964 holds lower grounds near intraday bottom after reversing from 21-EMA., @nehcap view: Recovery expected (Pivot Orderbook analysis)
…
This is a premium post.
[s2If !current_user_can(access_s2member_level4)]Please register for PREMIUM VERSION HERE to read full post below containing analysis. In case of any error or you think you are not able to read the full post below, please email us at support#nehcap.com [lwa][/s2If] [s2If current_user_can(access_s2member_level4)]
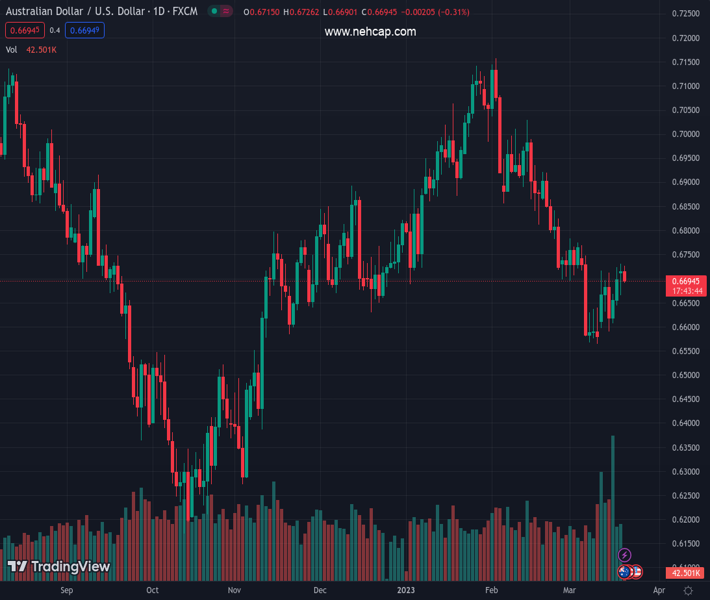
- AUD/USD holds lower grounds near intraday bottom after reversing from 21-EMA.
- Trendline breakout, bullish MACD signals favor buyers despite the latest retreat.
- Bulls need validation from 0.6780-85 resistance confluence to retake control.
The pair currently trades last at 0.66964.
The previous day high was 0.673 while the previous day low was 0.6666. The daily 38.2% Fib levels comes at 0.6706, expected to provide resistance. Similarly, the daily 61.8% fib level is at 0.669, expected to provide support.
AUD/USD prints the first daily loss in four around 0.6700 during early Tuesday morning in Europe as the 21-day Exponential Moving Average (EMA) challenges the buyers.
Even so, the Aussie pair’s successful trading beyond the previous resistance line from early February, near 0.6625 by the press time, join the bullish MACD signals to keep the buyers hopeful.
That said, a clear upside break of the 21-EMA, around 0.6720 by the press time, could direct the AUD/USD buyers towards the 0.6780-85 resistance confluence including 100-EMA, 50-EMA and 38.2% Fibonacci retracement of October 2022 to February 2023 upside.
Hence, the AUD/USD pair appears to remain sidelined between 0.6780-85 resistance and 0.6625 resistance-turned-support line.
It should be noted that a sustained break of 0.6785 could aim for the mid-February high surrounding 0.7030 wherein the 0.7000 round figure and early February’s low of 0.6855 may act as buffers.
Alternatively, a downside break of the stated trend line support, previous resistance around 0.6625, may aim for the 0.6600 round figure before approaching the monthly low of 0.6564.
Even if the quote drops below 0.6564, the 61.8% Fibonacci retracement, also known as the golden Fibonacci ratio, could challenge the AUD/USD bears around 0.6545.
To sum up, AUD/USD is likely to grind higher despite the latest retreat.
Trend: Recovery expected
Technical Levels: Supports and Resistances
AUDUSD currently trading at 0.6699 at the time of writing. Pair opened at 0.6719 and is trading with a change of -0.30% % .
| Overview | Overview.1 | |
|---|---|---|
| 0 | Today last price | 0.6699 |
| 1 | Today Daily Change | -0.0020 |
| 2 | Today Daily Change % | -0.30% |
| 3 | Today daily open | 0.6719 |
The pair remains strongly bearish on the daily time frame. It trades below the 20 SMA @ 0.6702, 50 SMA 0.6867, 100 SMA @ 0.6781 and 200 SMA @ 0.6764.
| Trends | Trends.1 | |
|---|---|---|
| 0 | Daily SMA20 | 0.6702 |
| 1 | Daily SMA50 | 0.6867 |
| 2 | Daily SMA100 | 0.6781 |
| 3 | Daily SMA200 | 0.6764 |
The previous day high was 0.673 while the previous day low was 0.6666. The daily 38.2% Fib levels comes at 0.6706, expected to provide resistance. Similarly, the daily 61.8% fib level is at 0.669, expected to provide support.
Note the levels of interest below:
- Pivot support is noted at 0.668, 0.6641, 0.6616
- Pivot resistance is noted at 0.6744, 0.6769, 0.6808
| Levels | Levels.1 |
|---|---|
| Previous Daily High | 0.6730 |
| Previous Daily Low | 0.6666 |
| Previous Weekly High | 0.6725 |
| Previous Weekly Low | 0.6579 |
| Previous Monthly High | 0.7158 |
| Previous Monthly Low | 0.6698 |
| Daily Fibonacci 38.2% | 0.6706 |
| Daily Fibonacci 61.8% | 0.6690 |
| Daily Pivot Point S1 | 0.6680 |
| Daily Pivot Point S2 | 0.6641 |
| Daily Pivot Point S3 | 0.6616 |
| Daily Pivot Point R1 | 0.6744 |
| Daily Pivot Point R2 | 0.6769 |
| Daily Pivot Point R3 | 0.6808 |
[/s2If]
Join Our Telegram Group
")


