#XAGUSD @ 20.667 Silver price struggles to extend recovery from four-month low, pares intraday gains during a three-day uptrend., @nehcap view: Further downside expected (Pivot Orderbook analysis)
…
This is a premium post.
[s2If !current_user_can(access_s2member_level4)]Please register for PREMIUM VERSION HERE to read full post below containing analysis. In case of any error or you think you are not able to read the full post below, please email us at support#nehcap.com [lwa][/s2If] [s2If current_user_can(access_s2member_level4)]
- Silver price struggles to extend recovery from four-month low, pares intraday gains during a three-day uptrend.
- Failure to cross short-term resistance line, downside break of 200-SMA lure XAG/USD sellers.
- Two-week-old horizontal support zone restricts immediate Silver price downside.
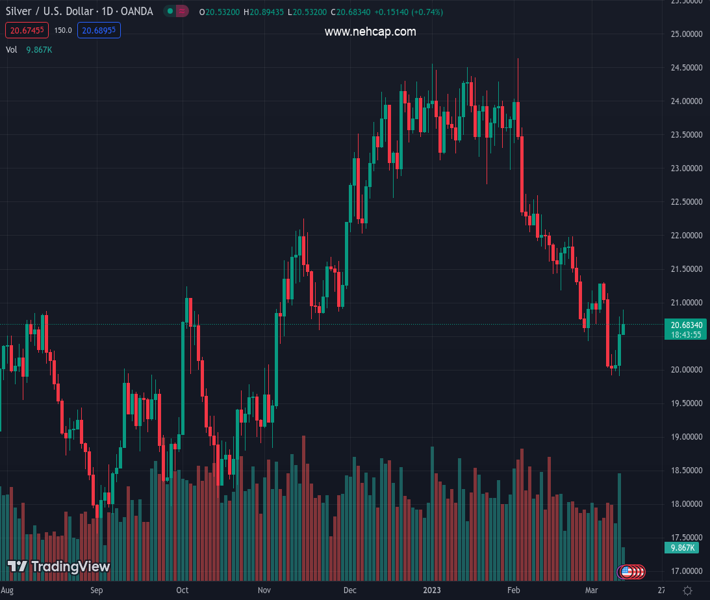
The pair currently trades last at 20.667.
The previous day high was 20.79 while the previous day low was 19.9. The daily 38.2% Fib levels comes at 20.45, expected to provide support. Similarly, the daily 61.8% fib level is at 20.24, expected to provide support.
Silver price (XAG/USD) clings to mild gains around $20.60 as it probes the metal’s pullback from a short-term key resistance line during early Monday. Even so, the XAG/USD prints the three-day winning streak, as well as extends the previous day’s rebound from the lowest levels since November 04, 2022.
That said, the looming bear cross on the MACD joins the bullion’s inability to stay beyond the 200-SMA, not to forget the failure to cross a two-week-old resistance line, which keeps the Silver price bears hopeful.
As a result, the bullion remains on the way to retesting the two-week-old horizontal support zone, close to $20.40 at the latest. However, the metal’s further downside may witness hardships in breaking the $20.00 psychological magnet.
Following that, the monthly low of $19.95 and the November 2022 bottom surrounding $18.85 will be in focus.
On the contrary, recovery moves remain elusive unless the XAG/USD stays below the downward-sloping resistance line from late February, around $20.90 at the latest. Also acting as an upside filter is the $21.00 round figure.
In a case where the Silver buyers keep control past $21.00, the last week’s high of around $21.30 may act as the last defense of the XAG/USD bears.
Trend: Further downside expected
Technical Levels: Supports and Resistances
XAGUSD currently trading at 20.6 at the time of writing. Pair opened at 20.53 and is trading with a change of 0.34% % .
| Overview | Overview.1 | |
|---|---|---|
| 0 | Today last price | 20.6 |
| 1 | Today Daily Change | 0.07 |
| 2 | Today Daily Change % | 0.34% |
| 3 | Today daily open | 20.53 |
The pair remains strongly bearish on the daily time frame. It trades below the 20 SMA @ 21.13, 50 SMA 22.52, 100 SMA @ 22.2 and 200 SMA @ 20.94.
| Trends | Trends.1 | |
|---|---|---|
| 0 | Daily SMA20 | 21.13 |
| 1 | Daily SMA50 | 22.52 |
| 2 | Daily SMA100 | 22.20 |
| 3 | Daily SMA200 | 20.94 |
The previous day high was 20.79 while the previous day low was 19.9. The daily 38.2% Fib levels comes at 20.45, expected to provide support. Similarly, the daily 61.8% fib level is at 20.24, expected to provide support.
Note the levels of interest below:
- Pivot support is noted at 20.02, 19.52, 19.13
- Pivot resistance is noted at 20.91, 21.3, 21.81
| Levels | Levels.1 |
|---|---|
| Previous Daily High | 20.79 |
| Previous Daily Low | 19.90 |
| Previous Weekly High | 21.31 |
| Previous Weekly Low | 19.90 |
| Previous Monthly High | 24.64 |
| Previous Monthly Low | 20.42 |
| Daily Fibonacci 38.2% | 20.45 |
| Daily Fibonacci 61.8% | 20.24 |
| Daily Pivot Point S1 | 20.02 |
| Daily Pivot Point S2 | 19.52 |
| Daily Pivot Point S3 | 19.13 |
| Daily Pivot Point R1 | 20.91 |
| Daily Pivot Point R2 | 21.30 |
| Daily Pivot Point R3 | 21.81 |
[/s2If]
Join Our Telegram Group
")


