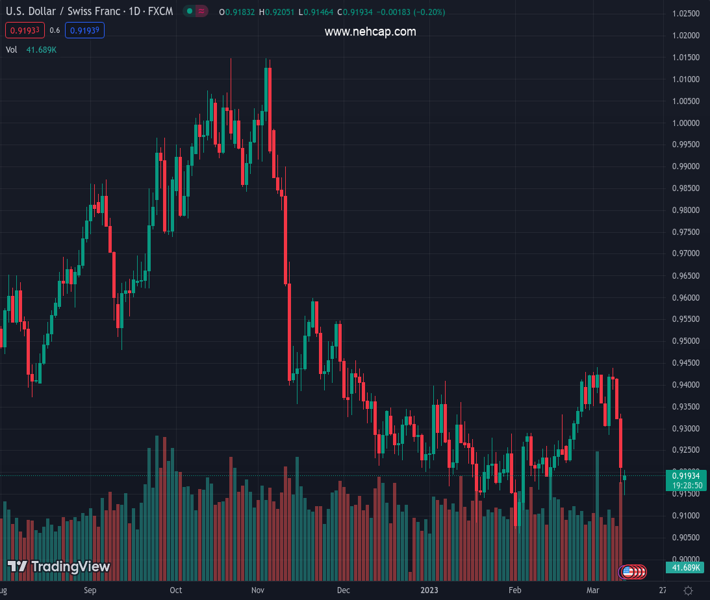
#USDCHF @ 0.91924 rebounds from one-month low but stays bearish for the fourth consecutive day., @nehcap view: Further recovery expected (Pivot Orderbook analysis)
…
This is a premium post.
[s2If !current_user_can(access_s2member_level4)]Please register for PREMIUM VERSION HERE to read full post below containing analysis. In case of any error or you think you are not able to read the full post below, please email us at support#nehcap.com [lwa][/s2If] [s2If current_user_can(access_s2member_level4)]
- USD/CHF rebounds from one-month low but stays bearish for the fourth consecutive day.
- Five-week-old ascending support line, oversold RSI challenges the bears.
- Bulls need validation from 200-SMA previous support line from early February.
The pair currently trades last at 0.91924.
The previous day high was 0.9343 while the previous day low was 0.9175. The daily 38.2% Fib levels comes at 0.9239, expected to provide resistance. Similarly, the daily 61.8% fib level is at 0.9279, expected to provide resistance.
USD/CHF bears struggle to keep the reins around a one-month low as it pares intraday losses near 0.9200 during early Monday. Even so, the Swiss Franc (CHF) pair stays in the red for the fourth consecutive day, while extending the previous week’s pullback.
The quote’s latest rebound could be linked to the oversold conditions of the Relative Strength Index (RSI) line, placed at 14, as well as the pair seller’s inability to break the upward-sloping support line from February 03, close to 0.9165 at the latest.
It should be noted, however, that the bearish MACD signals and the pair’s sustained trading below the previous support line from February 01, close to 0.9315 by the press time.
Apart from the support-turned-resistance line, the 200-SMA also challenges the USD/CHF rebound, at 0.9275 as we write.
In a case where USD/CHF remains firmer past 0.9275, the odds of witnessing a run-up towards the previous week’s double tops near 0.9440 appear brighter.
Alternatively, a downside break of the five-week-long ascending support line of near 0.9165 won’t hesitate to challenge the early February’s swing low around 0.9130 ahead of highlighting the previous monthly low of 0.9060 for the bears.
Should the USD/CHF sellers dominate past 0.9060, August 2021 low near 0.9020 and the 0.9000 psychological magnet will be in focus.
Trend: Further recovery expected
Technical Levels: Supports and Resistances
USDCHF currently trading at 0.9192 at the time of writing. Pair opened at 0.9214 and is trading with a change of -0.24% % .
| Overview | Overview.1 | |
|---|---|---|
| 0 | Today last price | 0.9192 |
| 1 | Today Daily Change | -0.0022 |
| 2 | Today Daily Change % | -0.24% |
| 3 | Today daily open | 0.9214 |
The pair remains strongly bearish on the daily time frame. It trades below the 20 SMA @ 0.9319, 50 SMA 0.9267, 100 SMA @ 0.9402 and 200 SMA @ 0.9561.
| Trends | Trends.1 | |
|---|---|---|
| 0 | Daily SMA20 | 0.9319 |
| 1 | Daily SMA50 | 0.9267 |
| 2 | Daily SMA100 | 0.9402 |
| 3 | Daily SMA200 | 0.9561 |
The previous day high was 0.9343 while the previous day low was 0.9175. The daily 38.2% Fib levels comes at 0.9239, expected to provide resistance. Similarly, the daily 61.8% fib level is at 0.9279, expected to provide resistance.
Note the levels of interest below:
- Pivot support is noted at 0.9145, 0.9075, 0.8976
- Pivot resistance is noted at 0.9313, 0.9413, 0.9482
| Levels | Levels.1 |
|---|---|
| Previous Daily High | 0.9343 |
| Previous Daily Low | 0.9175 |
| Previous Weekly High | 0.9439 |
| Previous Weekly Low | 0.9175 |
| Previous Monthly High | 0.9429 |
| Previous Monthly Low | 0.9059 |
| Daily Fibonacci 38.2% | 0.9239 |
| Daily Fibonacci 61.8% | 0.9279 |
| Daily Pivot Point S1 | 0.9145 |
| Daily Pivot Point S2 | 0.9075 |
| Daily Pivot Point S3 | 0.8976 |
| Daily Pivot Point R1 | 0.9313 |
| Daily Pivot Point R2 | 0.9413 |
| Daily Pivot Point R3 | 0.9482 |
[/s2If]
Join Our Telegram Group
")


