#EURUSD @ 1.06924 picks up bids to refresh intraday high amid firmer sentiment., @nehcap view: Pullback expected (Pivot Orderbook analysis)
…
This is a premium post.
[s2If !current_user_can(access_s2member_level4)]Please register for PREMIUM VERSION HERE to read full post below containing analysis. In case of any error or you think you are not able to read the full post below, please email us at support#nehcap.com [lwa][/s2If] [s2If current_user_can(access_s2member_level4)]
- EUR/USD picks up bids to refresh intraday high amid firmer sentiment.
- US regulators unveil action plan to tame risks emanating from Silicon Valley Bank, Signature Bank.
- Hidden bearish RSI divergence teases another pullback from 200-SMA but 100-SMA defends bulls.
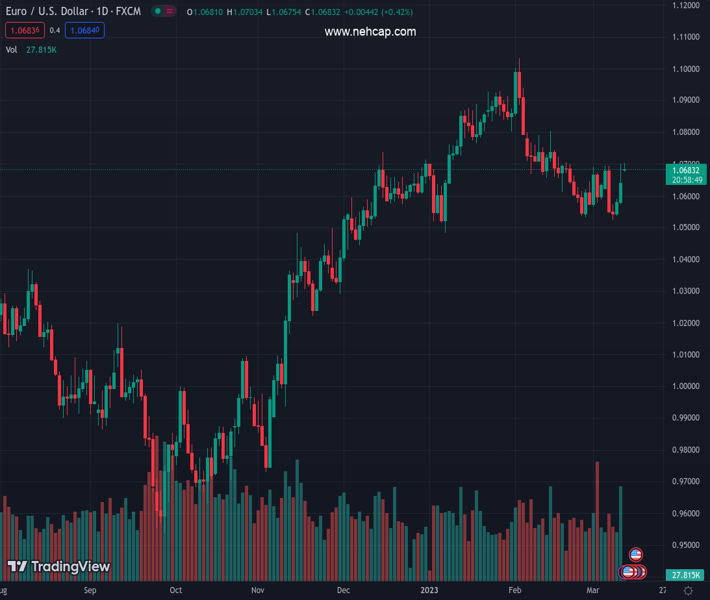
The pair currently trades last at 1.06924.
The previous day high was 1.0701 while the previous day low was 1.0574. The daily 38.2% Fib levels comes at 1.0652, expected to provide support. Similarly, the daily 61.8% fib level is at 1.0622, expected to provide support.
EUR/USD grinds near an intraday high of around 1.0700 during a three-day uptrend to Monday morning in Asia. In doing so, the major currency pair pokes the 200-SMA as the market’s upbeat sentiment weighs on the US Dollar’s haven demand. It should be noted, however, that the hidden bearish RSI divergence challenges the Euro buyers ahead of the European Central Bank (ECB) monetary policy meeting, up for Thursday.
Also read: AUD/USD marches towards 0.6650 as fears from SVB abate, Aussie employment, US inflation eyed
That said, the EUR/USD’s higher highs on price fail to gain support from the Relative Strength Index (RSI) 14 as it forms a lower high, which in turn suggests a lack of enough bullish momentum to cross the immediate key hurdle, namely the 200-SMA level surrounding 1.0710.
Even if the EUR/USD manages to surpass the 1.0710 resistance, the 50% Fibonacci retracement level of its early February-March downside, near 1.0780, will precede the mid-February swing high near 1.0810 to challenge the bulls.
On the flip side, EUR/USD pullback remains elusive unless the quote stays beyond the 100-SMA support of 1.0620. Following that, an upward-sloping trend line from the last Wednesday, close to 1.0585 at the latest, will be in focus.
In a case where the EUR/USD pair remains bearish past 1.0585, the odds of witnessing a fresh monthly low, currently around 1.0525, can’t be ruled out.
Trend: Pullback expected
Technical Levels: Supports and Resistances
EURUSD currently trading at 1.069 at the time of writing. Pair opened at 1.0637 and is trading with a change of 0.50% % .
| Overview | Overview.1 | |
|---|---|---|
| 0 | Today last price | 1.069 |
| 1 | Today Daily Change | 0.0053 |
| 2 | Today Daily Change % | 0.50% |
| 3 | Today daily open | 1.0637 |
The pair is trading above its 20 Daily moving average @ 1.0634, below its 50 Daily moving average @ 1.0722 , above its 100 Daily moving average @ 1.0534 and above its 200 Daily moving average @ 1.0326
| Trends | Trends.1 | |
|---|---|---|
| 0 | Daily SMA20 | 1.0634 |
| 1 | Daily SMA50 | 1.0722 |
| 2 | Daily SMA100 | 1.0534 |
| 3 | Daily SMA200 | 1.0326 |
The previous day high was 1.0701 while the previous day low was 1.0574. The daily 38.2% Fib levels comes at 1.0652, expected to provide support. Similarly, the daily 61.8% fib level is at 1.0622, expected to provide support.
Note the levels of interest below:
- Pivot support is noted at 1.0574, 1.0511, 1.0447
- Pivot resistance is noted at 1.07, 1.0764, 1.0827
| Levels | Levels.1 |
|---|---|
| Previous Daily High | 1.0701 |
| Previous Daily Low | 1.0574 |
| Previous Weekly High | 1.0701 |
| Previous Weekly Low | 1.0524 |
| Previous Monthly High | 1.1033 |
| Previous Monthly Low | 1.0533 |
| Daily Fibonacci 38.2% | 1.0652 |
| Daily Fibonacci 61.8% | 1.0622 |
| Daily Pivot Point S1 | 1.0574 |
| Daily Pivot Point S2 | 1.0511 |
| Daily Pivot Point S3 | 1.0447 |
| Daily Pivot Point R1 | 1.0700 |
| Daily Pivot Point R2 | 1.0764 |
| Daily Pivot Point R3 | 1.0827 |
[/s2If]
Join Our Telegram Group
")


