#XAGUSD @ 20.121 Silver bounces off a fresh four-month low touched earlier this Friday, though lacks follow-through. (Pivot Orderbook analysis)
…
This is a premium post.
[s2If !current_user_can(access_s2member_level4)]Please register for PREMIUM VERSION HERE to read full post below containing analysis. In case of any error or you think you are not able to read the full post below, please email us at support#nehcap.com [lwa][/s2If] [s2If current_user_can(access_s2member_level4)]
- Silver bounces off a fresh four-month low touched earlier this Friday, though lacks follow-through.
- A slightly oversold RSI on the daily charts supports prospects for some near-term recovery move.
- Bearish traders need to wait for an acceptance below the $20.00 mark before placing fresh bets.
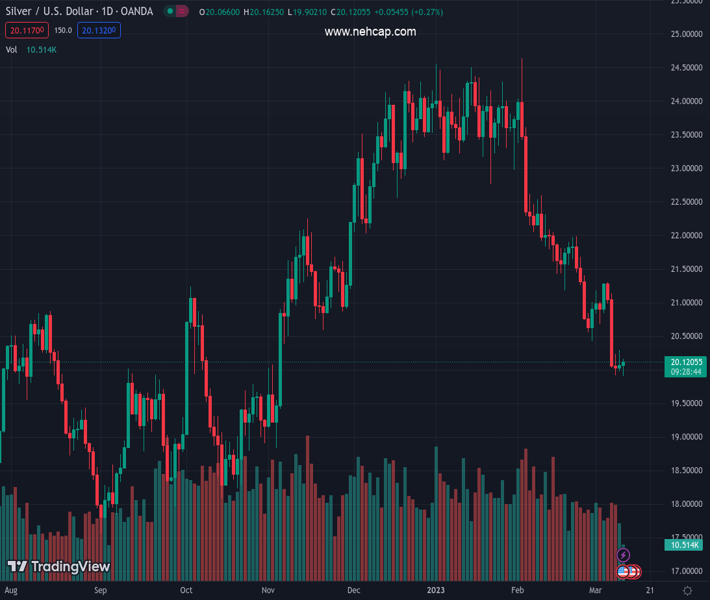
The pair currently trades last at 20.121.
The previous day high was 20.3 while the previous day low was 19.98. The daily 38.2% Fib levels comes at 20.17, expected to provide resistance. Similarly, the daily 61.8% fib level is at 20.1, expected to provide support.
Silver continues to show some resilience below the $20.00 psychological mark and reverses an intraday dip to a fresh four-month low touched earlier this Friday. The uptick, however, lacks bullish conviction, suggesting that the recent downfall witnessed over the past month or so might still be far from being over and positioning for any meaningful appreciating move.
Meanwhile, technical indicators on the daily chart languish in the oversold territory and support prospects for some upside in the near term. That said, the attempted recovery is more likely to confront stiff resistance near the $20.50-$20.40 horizontal support breakpoint, which coincided with the previous YTD low. Some follow-through buying, however, could trigger a short-covering move and lift the XAG/USD towards the 200-day Simple Moving Average (SMA), currently pegged just ahead of the $21.00 mark.
The latter should act as a pivotal point, which if cleared decisively will suggest that the recent pullback from the $24.65 region, or a multi-month peak touched in February has run its course and pave the way for additional gains. The XAG/USD might then accelerate the move towards the next relevant hurdle near the mid-$21.00s before aiming to reclaim the $22.00 round-figure mark.
On the flip side, bearish traders need to wait for an acceptance below the $20.00 mark before placing fresh bets. The subsequent slide could drag the XAG/USD towards the $19.60 intermediate support en route to the $19.00 round-figure mark. Some follow-through selling should pave the way for a slide towards the $18.80-$18.75 zone before the white metal drops to the $18.30-$18.25 zone and the $18.00 level.
Technical Levels: Supports and Resistances
XAGUSD currently trading at 20.13 at the time of writing. Pair opened at 20.06 and is trading with a change of 0.35 % .
| Overview | Overview.1 | |
|---|---|---|
| 0 | Today last price | 20.13 |
| 1 | Today Daily Change | 0.07 |
| 2 | Today Daily Change % | 0.35 |
| 3 | Today daily open | 20.06 |
The pair remains strongly bearish on the daily time frame. It trades below the 20 SMA @ 21.2, 50 SMA 22.58, 100 SMA @ 22.18 and 200 SMA @ 20.95.
| Trends | Trends.1 | |
|---|---|---|
| 0 | Daily SMA20 | 21.20 |
| 1 | Daily SMA50 | 22.58 |
| 2 | Daily SMA100 | 22.18 |
| 3 | Daily SMA200 | 20.95 |
The previous day high was 20.3 while the previous day low was 19.98. The daily 38.2% Fib levels comes at 20.17, expected to provide resistance. Similarly, the daily 61.8% fib level is at 20.1, expected to provide support.
Note the levels of interest below:
- Pivot support is noted at 19.93, 19.8, 19.61
- Pivot resistance is noted at 20.24, 20.43, 20.56
| Levels | Levels.1 |
|---|---|
| Previous Daily High | 20.30 |
| Previous Daily Low | 19.98 |
| Previous Weekly High | 21.27 |
| Previous Weekly Low | 20.42 |
| Previous Monthly High | 24.64 |
| Previous Monthly Low | 20.42 |
| Daily Fibonacci 38.2% | 20.17 |
| Daily Fibonacci 61.8% | 20.10 |
| Daily Pivot Point S1 | 19.93 |
| Daily Pivot Point S2 | 19.80 |
| Daily Pivot Point S3 | 19.61 |
| Daily Pivot Point R1 | 20.24 |
| Daily Pivot Point R2 | 20.43 |
| Daily Pivot Point R3 | 20.56 |
[/s2If]
Join Our Telegram Group
")


