#XAGUSD @ 20.009 Silver price fades bounce off four-month low after confirming bearish chart pattern earlier in Asia., @nehcap view: Further downside expected (Pivot Orderbook analysis)
…
This is a premium post.
[s2If !current_user_can(access_s2member_level4)]Please register for PREMIUM VERSION HERE to read full post below containing analysis. In case of any error or you think you are not able to read the full post below, please email us at support#nehcap.com [lwa][/s2If] [s2If current_user_can(access_s2member_level4)]
- Silver price fades bounce off four-month low after confirming bearish chart pattern earlier in Asia.
- Bearish MACD signals, sustained trading below the key EMAs keep XAG/USD sellers directed toward $18.80 theoretical target.
- Convergence of flag’s top line, 100-EMA appears short-term key upside hurdle to watch during corrective bounce.
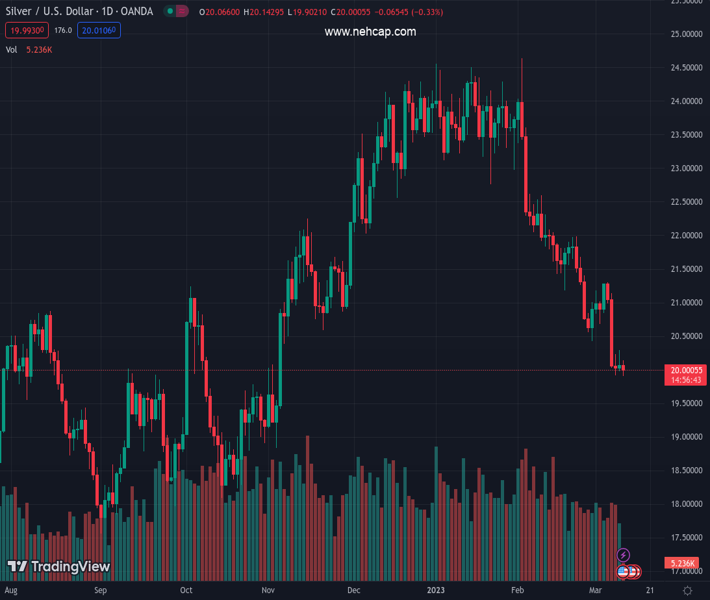
The pair currently trades last at 20.009.
The previous day high was 20.3 while the previous day low was 19.98. The daily 38.2% Fib levels comes at 20.17, expected to provide resistance. Similarly, the daily 61.8% fib level is at 20.1, expected to provide resistance.
Silver (XAG/USD) remains on the back foot around the $20.00 round figure amid early Friday in Europe, fading the bounce off the intraday low.
In doing so, the bright metal retreats from the lower line of a three-day-old bear flag, after confirming the downside suggesting chart formation earlier in the day.
Adding strength to the bearish bias are the downbeat MACD signals and the XAG/USD’s sustained trading below the 100 and 200 Exponential Moving Averages (EMAs).
That said, the recent lows marked around $19.90 and the latest October 2022 peak surrounding $19.75 may entertain the intraday sellers of the Silver during the theoretical target surrounding $18.80.
Meanwhile, recovery moves could aim for the convergence of the 100-EMA and the stated flag’s upper line, close to $20.35. Also acting as an upside filter is the 200-EMA level surrounding $20.65.
It should be noted that the monthly high near $21.30 holds the key to the Silver buyer’s conviction.
To sum up, the Silver price remains bearish and can refresh the four-month low marked earlier in the day.
Trend: Further downside expected
Technical Levels: Supports and Resistances
XAGUSD currently trading at 19.98 at the time of writing. Pair opened at 20.06 and is trading with a change of -0.40% % .
| Overview | Overview.1 | |
|---|---|---|
| 0 | Today last price | 19.98 |
| 1 | Today Daily Change | -0.08 |
| 2 | Today Daily Change % | -0.40% |
| 3 | Today daily open | 20.06 |
The pair remains strongly bearish on the daily time frame. It trades below the 20 SMA @ 21.2, 50 SMA 22.58, 100 SMA @ 22.18 and 200 SMA @ 20.95.
| Trends | Trends.1 | |
|---|---|---|
| 0 | Daily SMA20 | 21.20 |
| 1 | Daily SMA50 | 22.58 |
| 2 | Daily SMA100 | 22.18 |
| 3 | Daily SMA200 | 20.95 |
The previous day high was 20.3 while the previous day low was 19.98. The daily 38.2% Fib levels comes at 20.17, expected to provide resistance. Similarly, the daily 61.8% fib level is at 20.1, expected to provide resistance.
Note the levels of interest below:
- Pivot support is noted at 19.93, 19.8, 19.61
- Pivot resistance is noted at 20.24, 20.43, 20.56
| Levels | Levels.1 |
|---|---|
| Previous Daily High | 20.30 |
| Previous Daily Low | 19.98 |
| Previous Weekly High | 21.27 |
| Previous Weekly Low | 20.42 |
| Previous Monthly High | 24.64 |
| Previous Monthly Low | 20.42 |
| Daily Fibonacci 38.2% | 20.17 |
| Daily Fibonacci 61.8% | 20.10 |
| Daily Pivot Point S1 | 19.93 |
| Daily Pivot Point S2 | 19.80 |
| Daily Pivot Point S3 | 19.61 |
| Daily Pivot Point R1 | 20.24 |
| Daily Pivot Point R2 | 20.43 |
| Daily Pivot Point R3 | 20.56 |
[/s2If]
Join Our Telegram Group
")


