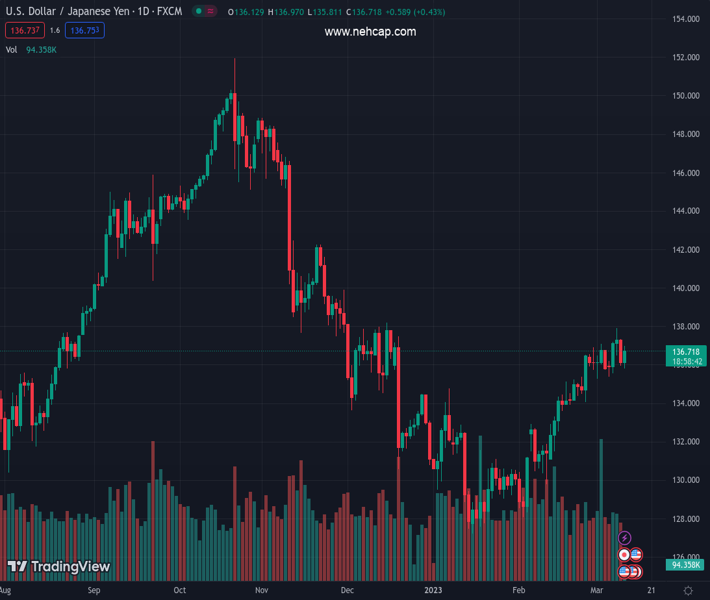
#USDJPY @ 136.616 initially rallied nearly 100 pips on BoJ’s status quo before retreating to 136.30. (Pivot Orderbook analysis)
…
This is a premium post.
[s2If !current_user_can(access_s2member_level4)]Please register for PREMIUM VERSION HERE to read full post below containing analysis. In case of any error or you think you are not able to read the full post below, please email us at support#nehcap.com [lwa][/s2If] [s2If current_user_can(access_s2member_level4)]
- USD/JPY initially rallied nearly 100 pips on BoJ’s status quo before retreating to 136.30.
- BoJ leaves benchmark rate unchanged at -0.10%, keeps YCC target surrounding 0.0%.
- BoJ Governor Kuroda will announce details of the latest moves around 06:00 GMT for the one last time.
- Comments from incoming BoJ Governor Ueda, US NFP will also be crucial for clear directions.
The pair currently trades last at 136.616.
The previous day high was 137.44 while the previous day low was 135.94. The daily 38.2% Fib levels comes at 136.51, expected to provide support. Similarly, the daily 61.8% fib level is at 136.86, expected to provide resistance.
USD/JPY portrays a stellar reaction to the Bank of Japan’s (BoJ) inaction during early Friday, initially rallying to 136.97 before retreating to 136.30. In doing so, the Yen pair justifies the Japanese policymaker’s dovish bias even as Governor Haruhiko Kuroda bid adieu after nearly a decade of defending the Asian major.
That said, the BoJ keeps the short-term interest rate target at -0.1% while directing 10-year Japanese Government Bond (JGB) yields within the band of +/-0.50%. The BoJ Statement, however, mentioned that inflationary expectations are rising, which in turn raises doubts about the future of the Japanese central bank’s ultra-easy monetary policy.
Also read: BoJ: Inflation expectations heightening
On the other hand, the US 10-year and two-year Treasury bond yields fall for the second consecutive day, to 3.83% and 4.76% in that order, and challenge the USD/JPY buyers ahead of the key press conference from BoJ Governor Kuroda.
That said, the latest fall in the yields could be linked to the geopolitical fears surrounding China and the US, as well as Russia, not to forget mixed US data and indecision for the Federal Reserve (Fed).
Mixed US data and impending inflation fears appear important catalysts for the markets to remain jittery as the US Initial Jobless Claims marked the biggest jump since January by rising to 211K for the week ended on March 03 versus 195K expected and 190K prior. Additionally, the Challenger Job Cuts were down and the Continuing Jobless Claims were up. It should be noted that the latest report from the New York Fed mentioned that recent upward revisions to inflation data coupled with higher-than-expected levels of inflation had changed the picture of what had appeared to be a cooling in price pressures.
Moving on, Kuroda’s speech will be crucial for the USD/JPY traders ahead of the US jobs report for February.
Unless marking a successful break of 200-DMA, around 137.50 by the press time, the USD/JPY remains on the bear’s radar.
Technical Levels: Supports and Resistances
USDJPY currently trading at 136.3 at the time of writing. Pair opened at 136.11 and is trading with a change of 0.14% % .
| Overview | Overview.1 | |
|---|---|---|
| 0 | Today last price | 136.3 |
| 1 | Today Daily Change | 0.19 |
| 2 | Today Daily Change % | 0.14% |
| 3 | Today daily open | 136.11 |
The pair is trading above its 20 Daily moving average @ 135.08, above its 50 Daily moving average @ 132.33 , above its 100 Daily moving average @ 136.11 and below its 200 Daily moving average @ 137.46
| Trends | Trends.1 | |
|---|---|---|
| 0 | Daily SMA20 | 135.08 |
| 1 | Daily SMA50 | 132.33 |
| 2 | Daily SMA100 | 136.11 |
| 3 | Daily SMA200 | 137.46 |
The previous day high was 137.44 while the previous day low was 135.94. The daily 38.2% Fib levels comes at 136.51, expected to provide support. Similarly, the daily 61.8% fib level is at 136.86, expected to provide resistance.
Note the levels of interest below:
- Pivot support is noted at 135.56, 135.0, 134.06
- Pivot resistance is noted at 137.05, 137.99, 138.55
| Levels | Levels.1 |
|---|---|
| Previous Daily High | 137.44 |
| Previous Daily Low | 135.94 |
| Previous Weekly High | 137.10 |
| Previous Weekly Low | 135.26 |
| Previous Monthly High | 136.92 |
| Previous Monthly Low | 128.08 |
| Daily Fibonacci 38.2% | 136.51 |
| Daily Fibonacci 61.8% | 136.86 |
| Daily Pivot Point S1 | 135.56 |
| Daily Pivot Point S2 | 135.00 |
| Daily Pivot Point S3 | 134.06 |
| Daily Pivot Point R1 | 137.05 |
| Daily Pivot Point R2 | 137.99 |
| Daily Pivot Point R3 | 138.55 |
[/s2If]
Join Our Telegram Group
")


