#USDINR @ 82.0380 bears attack a convergence of 50-SMA, one-week-old resistance line., @nehcap view: Further upside expected (Pivot Orderbook analysis)
…
This is a premium post.
[s2If !current_user_can(access_s2member_level4)]Please register for PREMIUM VERSION HERE to read full post below containing analysis. In case of any error or you think you are not able to read the full post below, please email us at support#nehcap.com [lwa][/s2If] [s2If current_user_can(access_s2member_level4)]
- USD/INR bears attack a convergence of 50-SMA, one-week-old resistance line.
- Upbeat oscillators suggest further recovery but 200-SMA acts as additional upside filter.
- Ascending trend line from Monday restricts immediate downside.
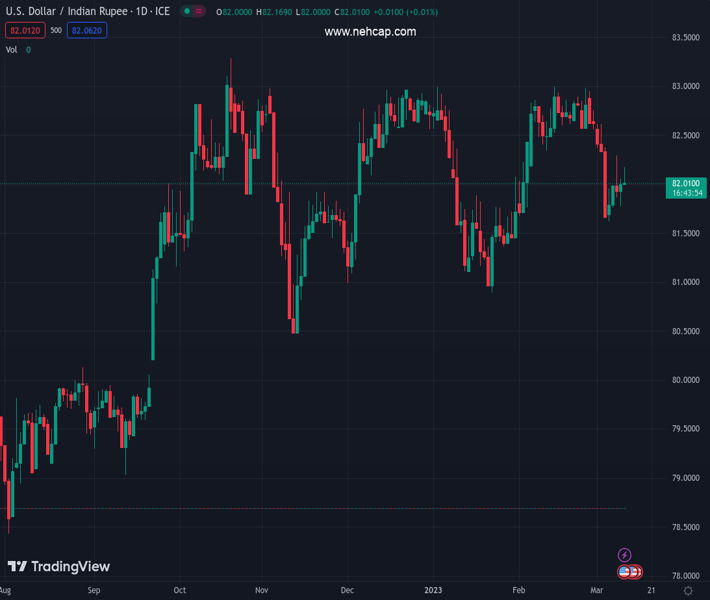
The pair currently trades last at 82.0380.
The previous day high was 82.0946 while the previous day low was 81.7675. The daily 38.2% Fib levels comes at 81.9697, expected to provide support. Similarly, the daily 61.8% fib level is at 81.8925, expected to provide support.
USD/INR struggles to extend the previous day’s recovery moves as it retreats to 82.00 round figure heading into Friday’s European session. In doing so, the Indian Rupee (INR) pair steps back from a convergence of the 50-bar Simple Moving Average (SMA) and a downward-sloping resistance line from February 27.
Even so, the bullish MACD signals and upward-sloping RSI (14), not overbought, keep USD/INR buyers hopeful of crossing the immediate 82.15 resistance confluence.
Following that, the 200-SMA level surrounding 82.35 acts as the last defense of the pair bears, a break of which could quickly propel the USD/INR prices toward the 23.6% Fibonacci retracement level of its late January-February upside, around 82.55.
It should be noted that the Indian Rupee’s weakness past 82.55 could help the USD/INR bulls to refresh the monthly high, currently around 83.10. In that case, the October 2022 peak of near 83.43 will be in focus.
On the flip side, USD/INR pullback may initially aim for the weekly support line, close to 81.80 at the latest.
However, the 61.8% Fibonacci retracement level and the monthly low, respectively near 81.70 and 81.60, could test the USD/INR bears before giving them control.
Overall, USD/INR is likely to recover but the road to the upside is long and bumpy.
Trend: Further upside expected
Technical Levels: Supports and Resistances
USDINR currently trading at 82.0255 at the time of writing. Pair opened at 82.0536 and is trading with a change of -0.03% % .
| Overview | Overview.1 | |
|---|---|---|
| 0 | Today last price | 82.0255 |
| 1 | Today Daily Change | -0.0281 |
| 2 | Today Daily Change % | -0.03% |
| 3 | Today daily open | 82.0536 |
The pair is trading below its 20 Daily moving average @ 82.4989, below its 50 Daily moving average @ 82.1629 , below its 100 Daily moving average @ 82.1302 and above its 200 Daily moving average @ 80.9667
| Trends | Trends.1 | |
|---|---|---|
| 0 | Daily SMA20 | 82.4989 |
| 1 | Daily SMA50 | 82.1629 |
| 2 | Daily SMA100 | 82.1302 |
| 3 | Daily SMA200 | 80.9667 |
The previous day high was 82.0946 while the previous day low was 81.7675. The daily 38.2% Fib levels comes at 81.9697, expected to provide support. Similarly, the daily 61.8% fib level is at 81.8925, expected to provide support.
Note the levels of interest below:
- Pivot support is noted at 81.8491, 81.6447, 81.522
- Pivot resistance is noted at 82.1763, 82.299, 82.5034
| Levels | Levels.1 |
|---|---|
| Previous Daily High | 82.0946 |
| Previous Daily Low | 81.7675 |
| Previous Weekly High | 83.0820 |
| Previous Weekly Low | 81.6486 |
| Previous Monthly High | 83.0820 |
| Previous Monthly Low | 81.5032 |
| Daily Fibonacci 38.2% | 81.9697 |
| Daily Fibonacci 61.8% | 81.8925 |
| Daily Pivot Point S1 | 81.8491 |
| Daily Pivot Point S2 | 81.6447 |
| Daily Pivot Point S3 | 81.5220 |
| Daily Pivot Point R1 | 82.1763 |
| Daily Pivot Point R2 | 82.2990 |
| Daily Pivot Point R3 | 82.5034 |
[/s2If]
Join Our Telegram Group
")


