#USDCHF @ 0.93202 takes offers to refresh intraday low, drops for the third consecutive day., @nehcap view: Further downside expected (Pivot Orderbook analysis)
…
This is a premium post.
[s2If !current_user_can(access_s2member_level4)]Please register for PREMIUM VERSION HERE to read full post below containing analysis. In case of any error or you think you are not able to read the full post below, please email us at support#nehcap.com [lwa][/s2If] [s2If current_user_can(access_s2member_level4)]
- USD/CHF takes offers to refresh intraday low, drops for the third consecutive day.
- Bearish chart formation, downbeat MACD conditions keep sellers hopeful.
- Five-week-old ascending support line, 200-SMA act as additional downside filters.
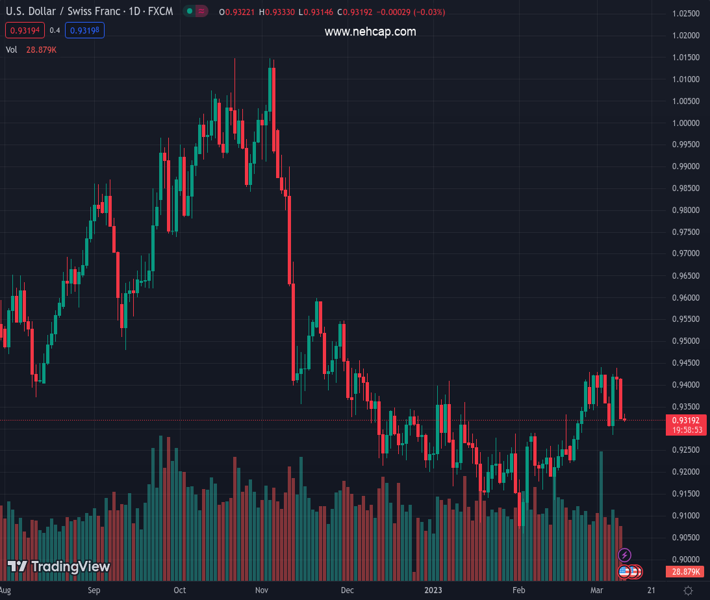
The pair currently trades last at 0.93202.
The previous day high was 0.942 while the previous day low was 0.9338. The daily 38.2% Fib levels comes at 0.9369, expected to provide resistance. Similarly, the daily 61.8% fib level is at 0.9388, expected to provide resistance.
USD/CHF holds onto the mid-week bearish bias as it drops to 0.9320 during early Friday. That said, the Swiss currency (CHF) pair portrays a bearish chart formation called “double tops” by marking failures to cross the 0.9440 hurdle. The same join the bearish MACD signals to keep the pair sellers hopeful.
However, an upward-sloping support line from early February, around the 0.9300 threshold at the latest, restricts the immediate downside of the pair ahead of the validation point of the bearish chart pattern, namely the early week’s low near 0.9285.
It’s worth noting that the 200-SMA can act as an extra check for the USD/CHF bears before directing them toward the theoretical target of 0.9130, provided the quote remains weak past 0.9285.
Meanwhile, the 0.9400 round figure may act as an immediate upside hurdle for the USD/CHF pair during the pair’s fresh advances.
Even so, the pair sellers can keep the reins unless the quote remains below the double tops marked surrounding 0.9440.
In a case where the USD/CHF price remains firmer past 0.9440, tops marked during late November 2022, around 0.9550 and the 0.9600 round figure, could challenge the pair buyers.
Overall, USD/CHF remains on the bear’s radar but a clear break of 0.9285 becomes necessary to witness further downside of the pair.
Trend: Further downside expected
Technical Levels: Supports and Resistances
USDCHF currently trading at 0.9322 at the time of writing. Pair opened at 0.9339 and is trading with a change of -0.18% % .
| Overview | Overview.1 | |
|---|---|---|
| 0 | Today last price | 0.9322 |
| 1 | Today Daily Change | -0.0017 |
| 2 | Today Daily Change % | -0.18% |
| 3 | Today daily open | 0.9339 |
The pair is trading above its 20 Daily moving average @ 0.932, above its 50 Daily moving average @ 0.9267 , below its 100 Daily moving average @ 0.941 and below its 200 Daily moving average @ 0.9563
| Trends | Trends.1 | |
|---|---|---|
| 0 | Daily SMA20 | 0.9320 |
| 1 | Daily SMA50 | 0.9267 |
| 2 | Daily SMA100 | 0.9410 |
| 3 | Daily SMA200 | 0.9563 |
The previous day high was 0.942 while the previous day low was 0.9338. The daily 38.2% Fib levels comes at 0.9369, expected to provide resistance. Similarly, the daily 61.8% fib level is at 0.9388, expected to provide resistance.
Note the levels of interest below:
- Pivot support is noted at 0.9311, 0.9284, 0.923
- Pivot resistance is noted at 0.9393, 0.9447, 0.9475
| Levels | Levels.1 |
|---|---|
| Previous Daily High | 0.9420 |
| Previous Daily Low | 0.9338 |
| Previous Weekly High | 0.9440 |
| Previous Weekly Low | 0.9342 |
| Previous Monthly High | 0.9429 |
| Previous Monthly Low | 0.9059 |
| Daily Fibonacci 38.2% | 0.9369 |
| Daily Fibonacci 61.8% | 0.9388 |
| Daily Pivot Point S1 | 0.9311 |
| Daily Pivot Point S2 | 0.9284 |
| Daily Pivot Point S3 | 0.9230 |
| Daily Pivot Point R1 | 0.9393 |
| Daily Pivot Point R2 | 0.9447 |
| Daily Pivot Point R3 | 0.9475 |
[/s2If]
Join Our Telegram Group
")


