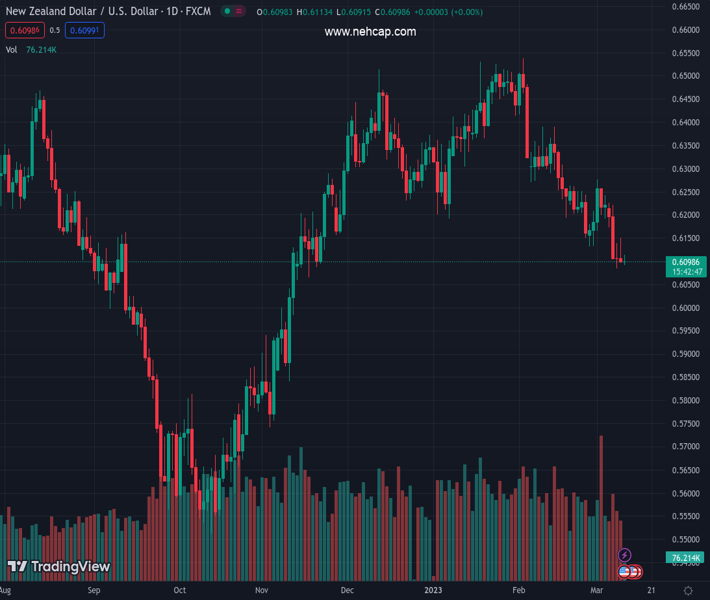
#NZDUSD @ 0.60991 fades bounce off the lowest levels since late November 2022, grinds lower of late., @nehcap view: Further downside expected (Pivot Orderbook analysis)
…
This is a premium post.
[s2If !current_user_can(access_s2member_level4)]Please register for PREMIUM VERSION HERE to read full post below containing analysis. In case of any error or you think you are not able to read the full post below, please email us at support#nehcap.com [lwa][/s2If] [s2If current_user_can(access_s2member_level4)]
- NZD/USD fades bounce off the lowest levels since late November 2022, grinds lower of late.
- 50-EMA pierces 200-EMA from above to portray death cross suggesting further downside of the Kiwi pair.
- Oversold RSI conditions, lows marked during mid-November challenge bears.
- Buyers need a successful break of 0.6265 to retake control.
The pair currently trades last at 0.60991.
The previous day high was 0.6152 while the previous day low was 0.6096. The daily 38.2% Fib levels comes at 0.6117, expected to provide resistance. Similarly, the daily 61.8% fib level is at 0.6131, expected to provide resistance.
NZD/USD extends the previous day’s pullback from mid-0.6100s as bears flirt with the 0.6100 threshold during early Friday. In doing so, the Kiwi pair justifies Thursday’s failure to cross the late February swing low.
That said, the 50-bar Exponential Moving Average (EMA) pierces the 200-EMA from above and portrays the death cross, which in turn suggests further downside of the NZD/USD.
However, the RSI (14) line is oversold and hence, lows marked during mid-November 2022, around 0.6060, may act as strong support for the NZD/USD bears to watch.
In a case where the Kiwi pair refrains from bouncing off 0.6060 support, it becomes vulnerable to drop towards the early November 2022 peak surrounding the 0.6000 psychological magnet.
Alternatively, a downward-sloping resistance line from February 14, close to the 0.6200 round figure, seems to challenge the NZD/USD pair’s immediate recovery.
It’s worth noting, though, that a convergence of the 50-EMA and 200-EMA, around 0.6265, appears a tough nut to crack for the NZD/USD bulls, a break of which could trigger a run-up targeting the mid-February swing high near 0.6390.
Overall, NZD/USD is likely to decline further but the room towards the south appears limited.
Trend: Further downside expected
Technical Levels: Supports and Resistances
NZDUSD currently trading at 0.61 at the time of writing. Pair opened at 0.6103 and is trading with a change of -0.05% % .
| Overview | Overview.1 | |
|---|---|---|
| 0 | Today last price | 0.61 |
| 1 | Today Daily Change | -0.0003 |
| 2 | Today Daily Change % | -0.05% |
| 3 | Today daily open | 0.6103 |
The pair remains strongly bearish on the daily time frame. It trades below the 20 SMA @ 0.6222, 50 SMA 0.6324, 100 SMA @ 0.6236 and 200 SMA @ 0.617.
| Trends | Trends.1 | |
|---|---|---|
| 0 | Daily SMA20 | 0.6222 |
| 1 | Daily SMA50 | 0.6324 |
| 2 | Daily SMA100 | 0.6236 |
| 3 | Daily SMA200 | 0.6170 |
The previous day high was 0.6152 while the previous day low was 0.6096. The daily 38.2% Fib levels comes at 0.6117, expected to provide resistance. Similarly, the daily 61.8% fib level is at 0.6131, expected to provide resistance.
Note the levels of interest below:
- Pivot support is noted at 0.6082, 0.6061, 0.6026
- Pivot resistance is noted at 0.6138, 0.6173, 0.6194
| Levels | Levels.1 |
|---|---|
| Previous Daily High | 0.6152 |
| Previous Daily Low | 0.6096 |
| Previous Weekly High | 0.6277 |
| Previous Weekly Low | 0.6131 |
| Previous Monthly High | 0.6538 |
| Previous Monthly Low | 0.6131 |
| Daily Fibonacci 38.2% | 0.6117 |
| Daily Fibonacci 61.8% | 0.6131 |
| Daily Pivot Point S1 | 0.6082 |
| Daily Pivot Point S2 | 0.6061 |
| Daily Pivot Point S3 | 0.6026 |
| Daily Pivot Point R1 | 0.6138 |
| Daily Pivot Point R2 | 0.6173 |
| Daily Pivot Point R3 | 0.6194 |
[/s2If]
Join Our Telegram Group
")


