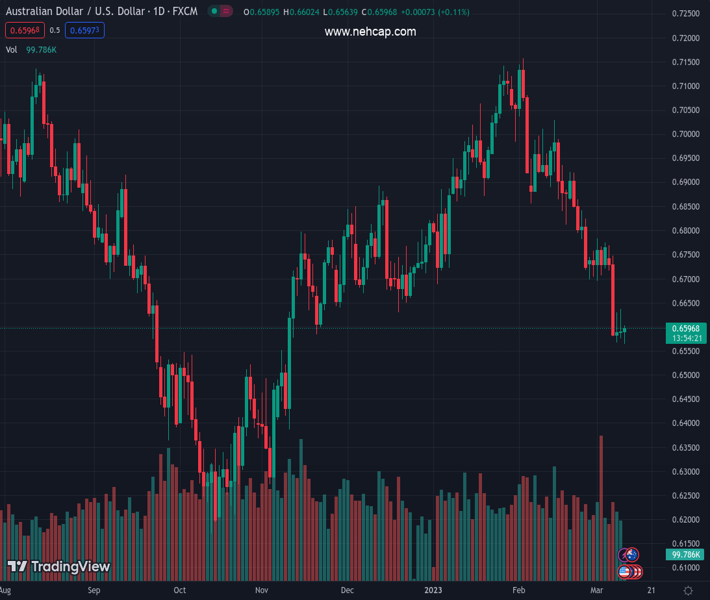
#AUDUSD @ 0.66005 reverses an intraday dip to a fresh YTD low amid the ongoing USD retracement slide. (Pivot Orderbook analysis)
…
This is a premium post.
[s2If !current_user_can(access_s2member_level4)]Please register for PREMIUM VERSION HERE to read full post below containing analysis. In case of any error or you think you are not able to read the full post below, please email us at support#nehcap.com [lwa][/s2If] [s2If current_user_can(access_s2member_level4)]
- AUD/USD reverses an intraday dip to a fresh YTD low amid the ongoing USD retracement slide.
- Reduced bets for a 50 bps Fed rate hike in March and falling US bond yields weigh on the buck.
- The risk-off mood might cap gains for the risk-sensitive Aussie ahead of the key US NFP report.
The pair currently trades last at 0.66005.
The previous day high was 0.6636 while the previous day low was 0.6576. The daily 38.2% Fib levels comes at 0.6599, expected to provide support. Similarly, the daily 61.8% fib level is at 0.6613, expected to provide resistance.
The AUD/USD pair attracts some buyers near the 0.6565 region on Friday and recovers early lost ground to a fresh four-month low. Spot prices climb back closer to the 0.6600 round-figure mark during the early European session and draw support from some follow-through US Dollar selling.
In fact, the USD Index, which tracks the Greenback against a basket of currencies, retreats further from a three-month high amid reduced bets for more aggressive policy tightening by the Federal Reserve. Data released on Thursday showed a larger-than-expected rise in the US Weekly Jobless Claims and was seen as the first sign of a softening labor market. This forced investors to reassess the possibility of a 50 bps lift-off at the upcoming FOMC meeting on March 21-22, which is evident from the ongoing downfall in the US Treasury bond yields and continues to weigh on the buck.
That said, the prevalent risk-off environment lends some support to the safe-haven Greenback and could keep a lid on any meaningful upside for the risk-sensitive Australian Dollar. The market sentiment remains fragile amid concerns about economic headwinds stemming from rapidly rising borrowing costs. Adding to this, the recent softer Chinese macro data dashed hopes for a strong recovery in the world’s second-largest economy and further fueled recession fears. This is reinforced by a deepening of the yield curve and tempers investors’ appetite for perceived riskier assets.
Apart from this, the Reserve Bank of Australia’s (RBA) dovish shift earlier this week, signalling that it might be nearing the end of its rate-hiking cycle, might contribute to capping gains for the AUD/USD pair. Traders might also prefer to move to the sidelines ahead of the release of the closely-watched US monthly jobs data, due later during the early North American session. The popularly known NFP report will play a key role in influencing the Fed’s policy outlook, which, in turn, will drive the USD demand and help determine the near-term trajectory for the major.
Technical Levels: Supports and Resistances
AUDUSD currently trading at 0.6591 at the time of writing. Pair opened at 0.6588 and is trading with a change of 0.05 % .
| Overview | Overview.1 | |
|---|---|---|
| 0 | Today last price | 0.6591 |
| 1 | Today Daily Change | 0.0003 |
| 2 | Today Daily Change % | 0.0500 |
| 3 | Today daily open | 0.6588 |
The pair remains strongly bearish on the daily time frame. It trades below the 20 SMA @ 0.6794, 50 SMA 0.6889, 100 SMA @ 0.6763 and 200 SMA @ 0.678.
| Trends | Trends.1 | |
|---|---|---|
| 0 | Daily SMA20 | 0.6794 |
| 1 | Daily SMA50 | 0.6889 |
| 2 | Daily SMA100 | 0.6763 |
| 3 | Daily SMA200 | 0.6780 |
The previous day high was 0.6636 while the previous day low was 0.6576. The daily 38.2% Fib levels comes at 0.6599, expected to provide support. Similarly, the daily 61.8% fib level is at 0.6613, expected to provide resistance.
Note the levels of interest below:
- Pivot support is noted at 0.6564, 0.654, 0.6504
- Pivot resistance is noted at 0.6624, 0.666, 0.6684
| Levels | Levels.1 |
|---|---|
| Previous Daily High | 0.6636 |
| Previous Daily Low | 0.6576 |
| Previous Weekly High | 0.6784 |
| Previous Weekly Low | 0.6695 |
| Previous Monthly High | 0.7158 |
| Previous Monthly Low | 0.6698 |
| Daily Fibonacci 38.2% | 0.6599 |
| Daily Fibonacci 61.8% | 0.6613 |
| Daily Pivot Point S1 | 0.6564 |
| Daily Pivot Point S2 | 0.6540 |
| Daily Pivot Point S3 | 0.6504 |
| Daily Pivot Point R1 | 0.6624 |
| Daily Pivot Point R2 | 0.6660 |
| Daily Pivot Point R3 | 0.6684 |
[/s2If]
Join Our Telegram Group
")


