Asian stocks are heavily punished as S&P500 was dumped heavily on Thursday. (Pivot Orderbook analysis)
…
This is a premium post.
[s2If !current_user_can(access_s2member_level4)]Please register for PREMIUM VERSION HERE to read full post below containing analysis. In case of any error or you think you are not able to read the full post below, please email us at support#nehcap.com [lwa][/s2If] [s2If current_user_can(access_s2member_level4)]
- Asian stocks are heavily punished as S&P500 was dumped heavily on Thursday.
- The headline of China’s XI Jinping selection for the third presidential term has failed to support Chinese stocks.
- Moderate capital expenditure and consumption in Japan cited by BoJ Kuroda has brought volatility in Nikkei225.
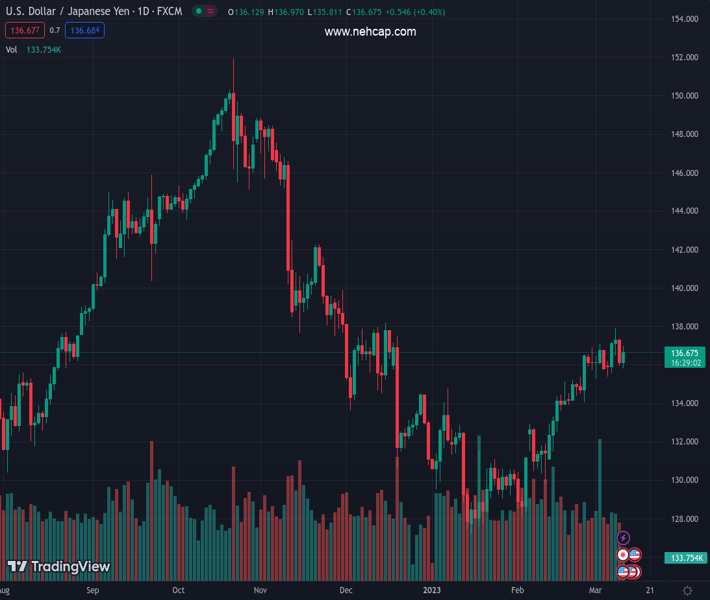
The pair currently trades last at 28245.16.
The previous day high was 28596.49 while the previous day low was 28192.46. The daily 38.2% Fib levels comes at 28346.8, expected to provide resistance. Similarly, the daily 61.8% fib level is at 28442.15, expected to provide resistance.
Markets in the Asian session are demonstrating a bloodbath as rising fears of aggressive interest rate hikes by the Federal Reserve (Fed) turned investors risk-averse. Asian stocks are discounting the intense sell-off that happened in the 500-US stocks basket on Thursday as expectations of upbeat labor market data are conveying that Fed chair Jerome Powell would have no other option than to paddle rates higher.
The US Dollar Index (DXY) has attempted a recovery move after two days of gradual correction. The USD Index is likely to regain the driving seat as investors might gung-ho for safe-haven assets after the release of the United States Nonfarm Payrolls (NFP) data, which will provide clarity on US labor market data.
At the press time, Japan’s Nikkei225 cracked 1.68%, ChinaA50 tumbled 1%, Hang Seng nosedived 2.62%, and Nifty50 surrendered more than 1%.
Fading optimism over Chinese economy recovery after the dismantling of pandemic controls has pushed equities to the south. Thursday’s weak inflation figures have cleared that the economy is struggling to steer its domestic demand.
Also, the headline of China’s XI Jinping selection for the third presidential term unanimously by the Chinese parliament has failed to support Chinese stocks.
Japanese equities have shown immense volatility as Bank of Japan (BoJ) Governor Haruhiko Kuroda favored the continuation of ultra-loose monetary policy in its last meeting. The statement from BoJ Kuroda that capital expenditure and consumption are moderate and exports and imports are trending sideways have triggered a sense of pessimism among investors as the central bank is disbursing heavy stimulus for a longer period.
On the oil front, oil prices have dropped to near $75.00 amid rising fears of a bleak economic outlook in the United States and China.
Technical Levels: Supports and Resistances
USDJPY currently trading at 28245.16 at the time of writing. Pair opened at 28245.16 and is trading with a change of 0.0 % .
| Overview | Overview.1 | |
|---|---|---|
| 0 | Today last price | 28245.16 |
| 1 | Today Daily Change | 0.00 |
| 2 | Today Daily Change % | 0.00 |
| 3 | Today daily open | 28245.16 |
The pair remains strongly bullish on the daily timeframe. It trades above its 20 SMA @ 27708.89, 50 SMA 27155.7, 100 SMA @ 27350.02 and 200 SMA @ 27353.92.
| Trends | Trends.1 | |
|---|---|---|
| 0 | Daily SMA20 | 27708.89 |
| 1 | Daily SMA50 | 27155.70 |
| 2 | Daily SMA100 | 27350.02 |
| 3 | Daily SMA200 | 27353.92 |
The previous day high was 28596.49 while the previous day low was 28192.46. The daily 38.2% Fib levels comes at 28346.8, expected to provide resistance. Similarly, the daily 61.8% fib level is at 28442.15, expected to provide resistance.
Note the levels of interest below:
- Pivot support is noted at 28092.92, 27940.67, 27688.89
- Pivot resistance is noted at 28496.95, 28748.73, 28900.98
| Levels | Levels.1 |
|---|---|
| Previous Daily High | 28596.49 |
| Previous Daily Low | 28192.46 |
| Previous Weekly High | 28242.05 |
| Previous Weekly Low | 27341.70 |
| Previous Monthly High | 27812.68 |
| Previous Monthly Low | 26985.47 |
| Daily Fibonacci 38.2% | 28346.80 |
| Daily Fibonacci 61.8% | 28442.15 |
| Daily Pivot Point S1 | 28092.92 |
| Daily Pivot Point S2 | 27940.67 |
| Daily Pivot Point S3 | 27688.89 |
| Daily Pivot Point R1 | 28496.95 |
| Daily Pivot Point R2 | 28748.73 |
| Daily Pivot Point R3 | 28900.98 |
[/s2If]
Join Our Telegram Group
")


