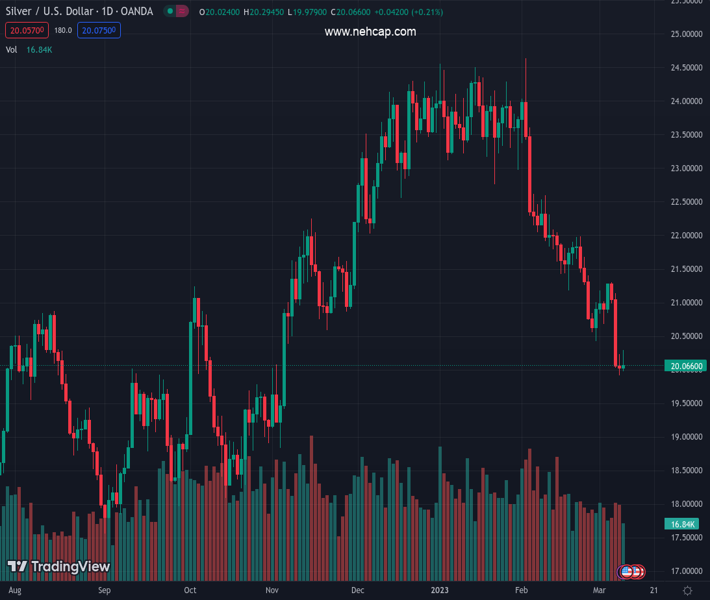
#XAGUSD @ 20.070 Silver remains firm at around $20.00 a troy ounce, ahead of essential US data. (Pivot Orderbook analysis)
…
This is a premium post.
[s2If !current_user_can(access_s2member_level4)]Please register for PREMIUM VERSION HERE to read full post below containing analysis. In case of any error or you think you are not able to read the full post below, please email us at support#nehcap.com [lwa][/s2If] [s2If current_user_can(access_s2member_level4)]
- Silver remains firm at around $20.00 a troy ounce, ahead of essential US data.
- XAG/USD Price Analysis: Despite consolidating around $20.00, the bias is still downwards.
The pair currently trades last at 20.070.
The previous day high was 20.23 while the previous day low was 19.92. The daily 38.2% Fib levels comes at 20.04, expected to provide support. Similarly, the daily 61.8% fib level is at 20.11, expected to provide resistance.
Silver price continues to trade sideways on Thursday, amidst the lack of a catalyst, ahead of the release of crucial US economic data. The US Nonfarm Payrolls report for February looming keeps investors risk averse, as shown by US equities and emerging market currencies, with the Mexican Peso (MXN) weakening. At the time of writing, the XAG/USD is trading at $20.05, up 0.19%.
XAG/USD remained firm during the day, unable to crack the top/bottom of the $19.98-$20.28 range. Nevertheless, traders should know Silver stumbled below the 200-day Exponential Moving Average (EMA) at $21.80, so the white metal is downward biased. Notable, the 50-day EMA is closing to the 200-day EMA, and once it crosses below the latter, a death cross would exacerbate a fall toward the November 3 daily low at $18.84.
But firstly, XAG/USD needs to clear the YTD low at $19.92. A breach of the latter will expose the $19.00 psychological level, followed by the November 3 daily low at $18.84.
As an alternate scenario, the XAG/USD first resistance would be the daily high of $20.06. Once cleared, the next resistance level would be the February 28 daily low-turned resistance at $20.43, followed by the November 28 daily low-turned resistance at $20.87.
Technical Levels: Supports and Resistances
XAGUSD currently trading at 20.08 at the time of writing. Pair opened at 20.02 and is trading with a change of 0.3 % .
| Overview | Overview.1 | |
|---|---|---|
| 0 | Today last price | 20.08 |
| 1 | Today Daily Change | 0.06 |
| 2 | Today Daily Change % | 0.30 |
| 3 | Today daily open | 20.02 |
The pair remains strongly bearish on the daily time frame. It trades below the 20 SMA @ 21.29, 50 SMA 22.66, 100 SMA @ 22.17 and 200 SMA @ 20.96.
| Trends | Trends.1 | |
|---|---|---|
| 0 | Daily SMA20 | 21.29 |
| 1 | Daily SMA50 | 22.66 |
| 2 | Daily SMA100 | 22.17 |
| 3 | Daily SMA200 | 20.96 |
The previous day high was 20.23 while the previous day low was 19.92. The daily 38.2% Fib levels comes at 20.04, expected to provide support. Similarly, the daily 61.8% fib level is at 20.11, expected to provide resistance.
Note the levels of interest below:
- Pivot support is noted at 19.88, 19.74, 19.57
- Pivot resistance is noted at 20.2, 20.37, 20.51
| Levels | Levels.1 |
|---|---|
| Previous Daily High | 20.23 |
| Previous Daily Low | 19.92 |
| Previous Weekly High | 21.27 |
| Previous Weekly Low | 20.42 |
| Previous Monthly High | 24.64 |
| Previous Monthly Low | 20.42 |
| Daily Fibonacci 38.2% | 20.04 |
| Daily Fibonacci 61.8% | 20.11 |
| Daily Pivot Point S1 | 19.88 |
| Daily Pivot Point S2 | 19.74 |
| Daily Pivot Point S3 | 19.57 |
| Daily Pivot Point R1 | 20.20 |
| Daily Pivot Point R2 | 20.37 |
| Daily Pivot Point R3 | 20.51 |
[/s2If]
Join Our Telegram Group
")


