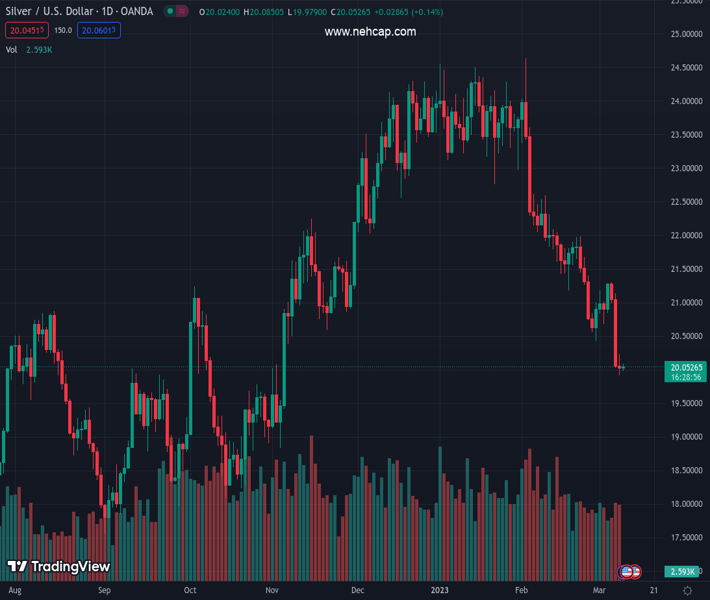
#XAGUSD @ 20.062 Silver price prints mild gains as it reverses from four-month low., @nehcap view: Further downside expected (Pivot Orderbook analysis)
…
This is a premium post.
[s2If !current_user_can(access_s2member_level4)]Please register for PREMIUM VERSION HERE to read full post below containing analysis. In case of any error or you think you are not able to read the full post below, please email us at support#nehcap.com [lwa][/s2If] [s2If current_user_can(access_s2member_level4)]
- Silver price prints mild gains as it reverses from four-month low.
- Short-term descending support line, oversold RSI adds strength to recovery.
- Doji candlestick, 100-DMA challenge XAG/USD buyers amid sluggish moves.
The pair currently trades last at 20.062.
The previous day high was 20.23 while the previous day low was 19.92. The daily 38.2% Fib levels comes at 20.04, expected to provide support. Similarly, the daily 61.8% fib level is at 20.11, expected to provide resistance.
Silver price (XAG/USD) picks up bids to rebound from the Year-To-Date (YTD) lows while printing mild gains around $20.00, up 0.18% intraday heading into Thursday’s European session.
In doing so, the bright metal bounces off a three-week-old descending support line, around $19.80 by the press time, amid an oversold RSI (14).
The XAG/USD rebound, however, appears elusive unless the quote stays below the previous day’s top surrounding $20.22.
That said, a clear upside break of $20.22 will defy the bearish candlestick formation and can propel the Silver price toward a late February swing low surrounding $20.45.
It’s worth noting, though, that the XAG/USD run-up beyond $20.45 needs validation from the $21.00 round figure and the 100-SMA hurdle of $21.15 to convince the buyers.
Meanwhile, pullback moves may retest the aforementioned support line, near $19.80. Following that, the $19.00 and November 2022 low surrounding $18.85 may entertain the Silver traders.
In a case where the XAG/USD bears keep the reins past $18.85, the previous yearly low surrounding $17.75, marked in September 2022, will be in focus.
Overall, the Silver bears appear running out of steam but the bulls have a long way to go before retaking control.
Trend: Further downside expected
Technical Levels: Supports and Resistances
XAGUSD currently trading at 20.08 at the time of writing. Pair opened at 20.02 and is trading with a change of 0.30% % .
| Overview | Overview.1 | |
|---|---|---|
| 0 | Today last price | 20.08 |
| 1 | Today Daily Change | 0.06 |
| 2 | Today Daily Change % | 0.30% |
| 3 | Today daily open | 20.02 |
The pair remains strongly bearish on the daily time frame. It trades below the 20 SMA @ 21.29, 50 SMA 22.66, 100 SMA @ 22.17 and 200 SMA @ 20.96.
| Trends | Trends.1 | |
|---|---|---|
| 0 | Daily SMA20 | 21.29 |
| 1 | Daily SMA50 | 22.66 |
| 2 | Daily SMA100 | 22.17 |
| 3 | Daily SMA200 | 20.96 |
The previous day high was 20.23 while the previous day low was 19.92. The daily 38.2% Fib levels comes at 20.04, expected to provide support. Similarly, the daily 61.8% fib level is at 20.11, expected to provide resistance.
Note the levels of interest below:
- Pivot support is noted at 19.88, 19.74, 19.57
- Pivot resistance is noted at 20.2, 20.37, 20.51
| Levels | Levels.1 |
|---|---|
| Previous Daily High | 20.23 |
| Previous Daily Low | 19.92 |
| Previous Weekly High | 21.27 |
| Previous Weekly Low | 20.42 |
| Previous Monthly High | 24.64 |
| Previous Monthly Low | 20.42 |
| Daily Fibonacci 38.2% | 20.04 |
| Daily Fibonacci 61.8% | 20.11 |
| Daily Pivot Point S1 | 19.88 |
| Daily Pivot Point S2 | 19.74 |
| Daily Pivot Point S3 | 19.57 |
| Daily Pivot Point R1 | 20.20 |
| Daily Pivot Point R2 | 20.37 |
| Daily Pivot Point R3 | 20.51 |
[/s2If]
Join Our Telegram Group
")


