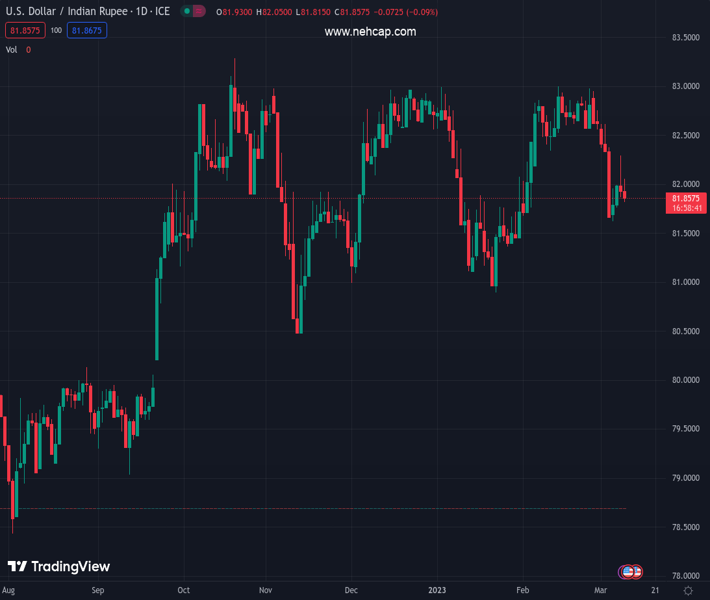
#USDINR @ 81.8680 extends the previous day’s pullback from one-week high, pressured around intraday low of late. (Pivot Orderbook analysis)
…
This is a premium post.
[s2If !current_user_can(access_s2member_level4)]Please register for PREMIUM VERSION HERE to read full post below containing analysis. In case of any error or you think you are not able to read the full post below, please email us at support#nehcap.com [lwa][/s2If] [s2If current_user_can(access_s2member_level4)]
- USD/INR extends the previous day’s pullback from one-week high, pressured around intraday low of late.
- US Dollar bulls take a breather at three-month high as traders await the key employment data amid mixed feelings.
- Cautious optimism in Asia adds strength to the Indian Rupee’s rebound.
- Second-tier data, risk catalysts eyed for intraday directions.
The pair currently trades last at 81.8680.
The previous day high was 82.3126 while the previous day low was 81.8595. The daily 38.2% Fib levels comes at 82.0326, expected to provide resistance. Similarly, the daily 61.8% fib level is at 82.1395, expected to provide resistance.
USD/INR clings to mild losses around 81.85-90 during early Thursday in Europe, extending the previous day’s pullback from a one-week high.
In doing so, the Indian Rupee (INR) pair cheers the US Dollar’s positioning for Friday’s jobs report amid sluggish early hours of trading. Adding strength to the USD retreat could be the inaction in the bond market as major yields remain sidelined after posting. With this, US Dollar Index (DXY) prints the first daily loss in three while keeping the early Asian session pullback from the highest levels since December 01, 2022.
It should be noted, however, that the cautious optimism in Asia, mainly due to the sluggish S&P 500 Futures joining downbeat China inflation data, seems to cap the INR strength. On the same line could be the downbeat Japan growth numbers and downbeat sentiment in India after the Holi holidays.
Elsewhere, an absence surprise in Fed Chair Powell’s Testimony 2.0 and mixed US data seemed to have triggered the US Dollar’s latest pullback. Furthermore, the US 10-year Treasury bond yields seesaw near 3.99% whereas the two-year counterpart pares intraday losses around 5.05% at the latest. It’s worth noting that US yield curve inversion widened to the highest levels since 1981 and propelled the recession fears on Wednesday.
It’s worth observing that the mixed US data seemed to have favored the USD/INR bears even if the early signals for Friday’s employment report are upbeat. That said, the US ADP Employment Change rose to 242K in February versus 200K market forecasts and 119K prior (revised). Further, the US Goods and Services Trade Balance dropped to $-68.3B from the $-67.2B previous reading (revised) and $-68.9B analysts’ estimations. It should be noted that the US JOLTS Job Openings for January improved to 10.824M versus 10.6M expected but eased from 11.234M revised prior.
To sum up, USD/INR is more likely a technical play than a fundamental as the pair’s inability to cross the 100-DMA keeps bears hopeful despite the likely improvement in the US Dollar.
USD/INR’s failure to cross the 100-DMA hurdle during the previous day’s run-up, around 82.13 by the press time, keeps the bears hopeful of witnessing a slump towards an ascending support line from early November, close to 81.35 at the latest.
Technical Levels: Supports and Resistances
USDINR currently trading at 81.885 at the time of writing. Pair opened at 81.9663 and is trading with a change of -0.10% % .
| Overview | Overview.1 | |
|---|---|---|
| 0 | Today last price | 81.885 |
| 1 | Today Daily Change | -0.0813 |
| 2 | Today Daily Change % | -0.10% |
| 3 | Today daily open | 81.9663 |
The pair is trading below its 20 Daily moving average @ 82.5245, below its 50 Daily moving average @ 82.1793 , below its 100 Daily moving average @ 82.1381 and above its 200 Daily moving average @ 80.9433
| Trends | Trends.1 | |
|---|---|---|
| 0 | Daily SMA20 | 82.5245 |
| 1 | Daily SMA50 | 82.1793 |
| 2 | Daily SMA100 | 82.1381 |
| 3 | Daily SMA200 | 80.9433 |
The previous day high was 82.3126 while the previous day low was 81.8595. The daily 38.2% Fib levels comes at 82.0326, expected to provide resistance. Similarly, the daily 61.8% fib level is at 82.1395, expected to provide resistance.
Note the levels of interest below:
- Pivot support is noted at 81.7797, 81.5931, 81.3266
- Pivot resistance is noted at 82.2327, 82.4992, 82.6858
| Levels | Levels.1 |
|---|---|
| Previous Daily High | 82.3126 |
| Previous Daily Low | 81.8595 |
| Previous Weekly High | 83.0820 |
| Previous Weekly Low | 81.6486 |
| Previous Monthly High | 83.0820 |
| Previous Monthly Low | 81.5032 |
| Daily Fibonacci 38.2% | 82.0326 |
| Daily Fibonacci 61.8% | 82.1395 |
| Daily Pivot Point S1 | 81.7797 |
| Daily Pivot Point S2 | 81.5931 |
| Daily Pivot Point S3 | 81.3266 |
| Daily Pivot Point R1 | 82.2327 |
| Daily Pivot Point R2 | 82.4992 |
| Daily Pivot Point R3 | 82.6858 |
[/s2If]
Join Our Telegram Group
")


