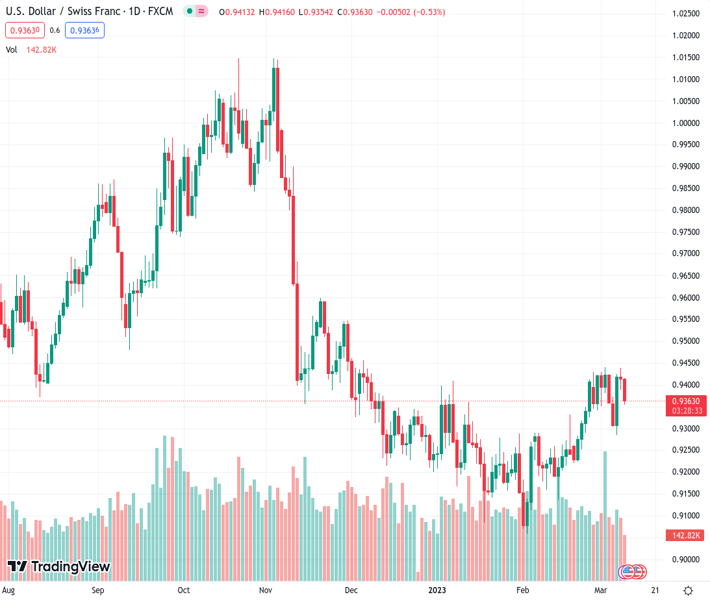
#USDCHF @ 0.93650 plunges below the 100-day EMA, with sellers eyeing the 50-day EMA at 0.9310s. (Pivot Orderbook analysis)
…
This is a premium post.
[s2If !current_user_can(access_s2member_level4)]Please register for PREMIUM VERSION HERE to read full post below containing analysis. In case of any error or you think you are not able to read the full post below, please email us at support#nehcap.com [lwa][/s2If] [s2If current_user_can(access_s2member_level4)]
- USD/CHF plunges below the 100-day EMA, with sellers eyeing the 50-day EMA at 0.9310s.
- Oscillators remain in negative territory, warranting further downside in the USD/CHF pair.
- USD/CHF Price Analysis: Sellers reclaiming the 20-day EMA would pave the way to 0.9300.
The pair currently trades last at 0.93650.
The previous day high was 0.9439 while the previous day low was 0.9389. The daily 38.2% Fib levels comes at 0.9408, expected to provide resistance. Similarly, the daily 61.8% fib level is at 0.942, expected to provide resistance.
The USD/CHF reverses its upward course and trims some of its weekly gains after the pair was shy of testing the 200-day Exponential Moving Average (EMA) at 0.9448. Consequently, sellers stepped in and tumbled the USD/CHF pair below 0.9400. At the time of typing, the USD/CHF is trading at 0.9357, down 0.59%.
During Thursday’s session, the USD/CHF retreated below 0.9400, with sellers reclaiming the 100-day EMA at 0.9384. Even though the USD/CHF is falling, it’s facing solid support around 0.93500, which, once cleared, could pave the USD/CHF’s way toward the 20-day EMA at 0.9333. A breach of the latter and the USD/CHF could fall to the 50-day EMA at 0.9316.
Oscillators like the Relative Strength Index (RSI) favor sellers, while the Rate of Change (RoC), portrays buyers losing momentum. Therefore, the USD/CHF could test the 0.9300 figure in the near term.
As an alternate scenario, the USD/CHF first resistance would be the 0.9400 figure. Once broken, the USD/CHF could test the YTD low at 0.9440 before reaching the 200-day EMA at 0.9448.
Technical Levels: Supports and Resistances
USDCHF currently trading at 0.9359 at the time of writing. Pair opened at 0.9412 and is trading with a change of -0.56 % .
| Overview | Overview.1 | |
|---|---|---|
| 0 | Today last price | 0.9359 |
| 1 | Today Daily Change | -0.0053 |
| 2 | Today Daily Change % | -0.5600 |
| 3 | Today daily open | 0.9412 |
The pair is trading above its 20 Daily moving average @ 0.9314, above its 50 Daily moving average @ 0.9265 , below its 100 Daily moving average @ 0.9417 and below its 200 Daily moving average @ 0.9564
| Trends | Trends.1 | |
|---|---|---|
| 0 | Daily SMA20 | 0.9314 |
| 1 | Daily SMA50 | 0.9265 |
| 2 | Daily SMA100 | 0.9417 |
| 3 | Daily SMA200 | 0.9564 |
The previous day high was 0.9439 while the previous day low was 0.9389. The daily 38.2% Fib levels comes at 0.9408, expected to provide resistance. Similarly, the daily 61.8% fib level is at 0.942, expected to provide resistance.
Note the levels of interest below:
- Pivot support is noted at 0.9388, 0.9363, 0.9338
- Pivot resistance is noted at 0.9438, 0.9463, 0.9488
| Levels | Levels.1 |
|---|---|
| Previous Daily High | 0.9439 |
| Previous Daily Low | 0.9389 |
| Previous Weekly High | 0.9440 |
| Previous Weekly Low | 0.9342 |
| Previous Monthly High | 0.9429 |
| Previous Monthly Low | 0.9059 |
| Daily Fibonacci 38.2% | 0.9408 |
| Daily Fibonacci 61.8% | 0.9420 |
| Daily Pivot Point S1 | 0.9388 |
| Daily Pivot Point S2 | 0.9363 |
| Daily Pivot Point S3 | 0.9338 |
| Daily Pivot Point R1 | 0.9438 |
| Daily Pivot Point R2 | 0.9463 |
| Daily Pivot Point R3 | 0.9488 |
[/s2If]
Join Our Telegram Group
")


