#USDCAD @ 1.38033 struggles to extend three-day uptrend near five-month-old horizontal resistance., @nehcap view: Pullback expected (Pivot Orderbook analysis)
…
This is a premium post.
[s2If !current_user_can(access_s2member_level4)]Please register for PREMIUM VERSION HERE to read full post below containing analysis. In case of any error or you think you are not able to read the full post below, please email us at support#nehcap.com [lwa][/s2If] [s2If current_user_can(access_s2member_level4)]
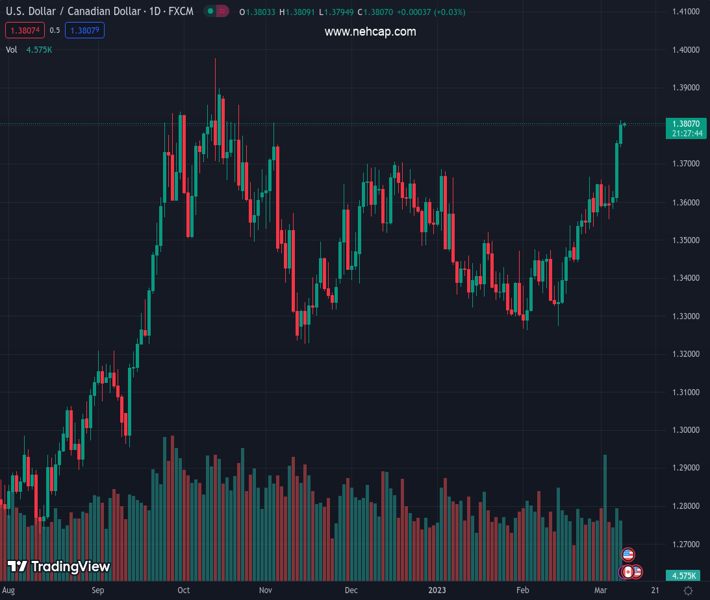
- USD/CAD struggles to extend three-day uptrend near five-month-old horizontal resistance.
- Overbought RSI (14) questions the Loonie pair’s further upside targeting 2022 peak.
- Bears have a bumpy road ahead, 1.3700 restricts immediate declines.
The pair currently trades last at 1.38033.
The previous day high was 1.3815 while the previous day low was 1.3745. The daily 38.2% Fib levels comes at 1.3788, expected to provide support. Similarly, the daily 61.8% fib level is at 1.3772, expected to provide support.
USD/CAD makes rounds to 1.3800 as bulls take a breather near the highest levels since late October 2022 during early Thursday.
The Loonie pair’s latest inaction could be linked to the overbought RSI (14) conditions, as well as the quote’s failure to cross the key horizontal resistance zone established during late September.
The pullback moves, however, remain elusive as multiple tops marked during the last December challenge the USD/CAD bears around 1.3700.
Following that, an upward-sloping support line from February 14, close to 1.3640 by the press time, will be important to watch for the pair sellers.
Should the quote remains bearish past 1.3640, the 100-dMA level surrounding 1.3500 will act as the last defense of the USD/CAD buyers.
It’s worth noting that the previous weekly low surrounding 1.3555 acts as an intermediate halt between 1.3640 and 1.3500.
Alternatively, a successful upside break of the 1.3810-30 resistance region could quickly propel the USD/CAD price towards the year 2022 peak of near 1.3980. That said, the mid-October 2022 high near 1.3890 may act as a buffer during the Loonie pair’s run-up targeting to refresh the multi-month high marked in late 2022.
Overall, USD/CAD remains on the buyer’s radar even if the pair’s further upside appears limited of late.
Trend: Pullback expected
Technical Levels: Supports and Resistances
USDCAD currently trading at 1.3803 at the time of writing. Pair opened at 1.3793 and is trading with a change of 0.07% % .
| Overview | Overview.1 | |
|---|---|---|
| 0 | Today last price | 1.3803 |
| 1 | Today Daily Change | 0.0010 |
| 2 | Today Daily Change % | 0.07% |
| 3 | Today daily open | 1.3793 |
The pair remains strongly bullish on the daily timeframe. It trades above its 20 SMA @ 1.3533, 50 SMA 1.3468, 100 SMA @ 1.3501 and 200 SMA @ 1.33.
| Trends | Trends.1 | |
|---|---|---|
| 0 | Daily SMA20 | 1.3533 |
| 1 | Daily SMA50 | 1.3468 |
| 2 | Daily SMA100 | 1.3501 |
| 3 | Daily SMA200 | 1.3300 |
The previous day high was 1.3815 while the previous day low was 1.3745. The daily 38.2% Fib levels comes at 1.3788, expected to provide support. Similarly, the daily 61.8% fib level is at 1.3772, expected to provide support.
Note the levels of interest below:
- Pivot support is noted at 1.3754, 1.3715, 1.3684
- Pivot resistance is noted at 1.3823, 1.3854, 1.3893
| Levels | Levels.1 |
|---|---|
| Previous Daily High | 1.3815 |
| Previous Daily Low | 1.3745 |
| Previous Weekly High | 1.3659 |
| Previous Weekly Low | 1.3534 |
| Previous Monthly High | 1.3666 |
| Previous Monthly Low | 1.3262 |
| Daily Fibonacci 38.2% | 1.3788 |
| Daily Fibonacci 61.8% | 1.3772 |
| Daily Pivot Point S1 | 1.3754 |
| Daily Pivot Point S2 | 1.3715 |
| Daily Pivot Point S3 | 1.3684 |
| Daily Pivot Point R1 | 1.3823 |
| Daily Pivot Point R2 | 1.3854 |
| Daily Pivot Point R3 | 1.3893 |
[/s2If]
Join Our Telegram Group
")


