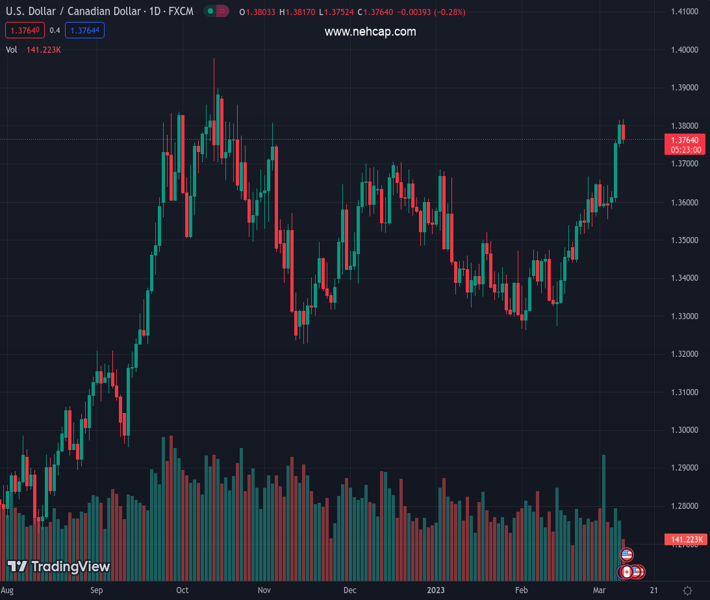
#USDCAD @ 1.37668 climbs to its highest level since October and seems poised to appreciate further. (Pivot Orderbook analysis)
…
This is a premium post.
[s2If !current_user_can(access_s2member_level4)]Please register for PREMIUM VERSION HERE to read full post below containing analysis. In case of any error or you think you are not able to read the full post below, please email us at support#nehcap.com [lwa][/s2If] [s2If current_user_can(access_s2member_level4)]
- USD/CAD climbs to its highest level since October and seems poised to appreciate further.
- A slightly overbought RSI on the daily chart might hold back bulls from placing fresh bets.
- Any meaningful corrective slide could be seen as a buying opportunity and remain limited.
The pair currently trades last at 1.37668.
The previous day high was 1.3815 while the previous day low was 1.3745. The daily 38.2% Fib levels comes at 1.3788, expected to provide resistance. Similarly, the daily 61.8% fib level is at 1.3772, expected to provide resistance.
The USD/CAD pair attracts some dip-buying near the 1.3785 region and climbs to a fresh high since October 21 during the early North American session on Thursday. The pair currently trades just above the 1.3800 mark and seems poised to extend its recent upward trajectory witnessed over the past three weeks or so.
Crude Oil prices languish near the weekly low amid concerns that a deeper global economic downturn will dent fuel demand and fading optimism over a strong recovery in China. This, in turn, is seen undermining the commodity-linked Loonie and acting as a tailwind for the USD/CAD pair. Bulls, meanwhile, seem rather unaffected by a modest US Dollar pullback from over a three-month peak.
The downside for the USD, however, remains cushioned amid bets for a 50 bps lift-off at the upcoming FOMC policy meeting on March 21-22. Moreover, looming recession risks should benefit the safe-haven buck. This, along with the fact that the Bank of Canada (BoC) became the first major central bank to pause its rate-hiking cycle on Wednesday, validates the positive outlook for the USD/CAD pair.
From a technical perspective, a sustained move beyond the 1.3700 horizontal barrier on Tuesday was seen as a fresh trigger for bullish traders. The subsequent move up validates the breakout and supports prospects for a further near-term appreciating move. That said, Relative Strength Index (RSI) on the daily chart is flashing slightly overbought conditions and warrants caution before placing fresh bets.
Nevertheless, the USD/CAD pair remains on track to climb further towards an intermediate hurdle near the 1.3870-1.3880 region en route to the 1.3900 round-figure mark. The positive momentum could get extended further, which should allow bulls to challenge the 2022 swing high, around the 1.3975-1.3980 zone, and then aim to reclaim the 1.4000 psychological mark.
On the flip side, any meaningful corrective decline now seems to find some support near the 1.3750-1.3745 area. Any further decline is more likely to attract fresh buyers near the 1.3700 horizontal resistance breakpoint. The latter should act as a pivotal point, which if broken might prompt some technical selling and drag the USD/CAD pair back towards the 1.3600 mark en route to the 1.3560 support zone.
Technical Levels: Supports and Resistances
USDCAD currently trading at 1.3809 at the time of writing. Pair opened at 1.3793 and is trading with a change of 0.12 % .
| Overview | Overview.1 | |
|---|---|---|
| 0 | Today last price | 1.3809 |
| 1 | Today Daily Change | 0.0016 |
| 2 | Today Daily Change % | 0.1200 |
| 3 | Today daily open | 1.3793 |
The pair remains strongly bullish on the daily timeframe. It trades above its 20 SMA @ 1.3533, 50 SMA 1.3468, 100 SMA @ 1.3501 and 200 SMA @ 1.33.
| Trends | Trends.1 | |
|---|---|---|
| 0 | Daily SMA20 | 1.3533 |
| 1 | Daily SMA50 | 1.3468 |
| 2 | Daily SMA100 | 1.3501 |
| 3 | Daily SMA200 | 1.3300 |
The previous day high was 1.3815 while the previous day low was 1.3745. The daily 38.2% Fib levels comes at 1.3788, expected to provide resistance. Similarly, the daily 61.8% fib level is at 1.3772, expected to provide resistance.
Note the levels of interest below:
- Pivot support is noted at 1.3754, 1.3715, 1.3684
- Pivot resistance is noted at 1.3823, 1.3854, 1.3893
| Levels | Levels.1 |
|---|---|
| Previous Daily High | 1.3815 |
| Previous Daily Low | 1.3745 |
| Previous Weekly High | 1.3659 |
| Previous Weekly Low | 1.3534 |
| Previous Monthly High | 1.3666 |
| Previous Monthly Low | 1.3262 |
| Daily Fibonacci 38.2% | 1.3788 |
| Daily Fibonacci 61.8% | 1.3772 |
| Daily Pivot Point S1 | 1.3754 |
| Daily Pivot Point S2 | 1.3715 |
| Daily Pivot Point S3 | 1.3684 |
| Daily Pivot Point R1 | 1.3823 |
| Daily Pivot Point R2 | 1.3854 |
| Daily Pivot Point R3 | 1.3893 |
[/s2If]
Join Our Telegram Group
")


