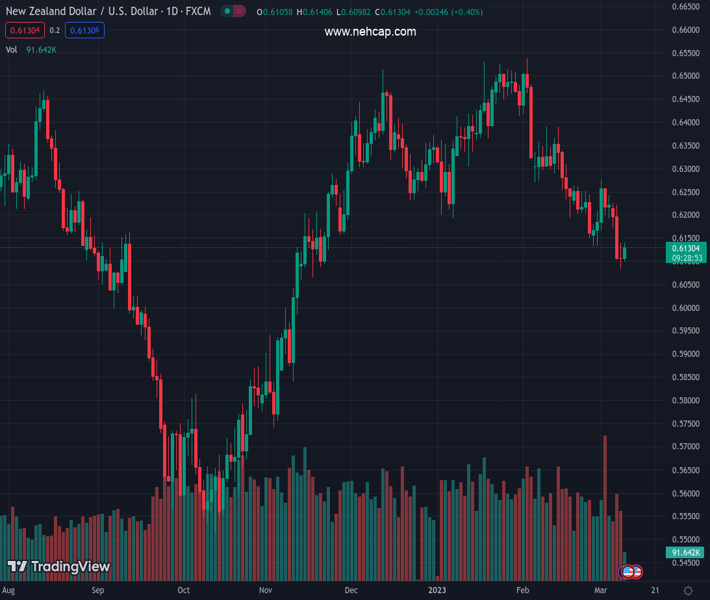
#NZDUSD @ 0.61312 gains strong positive traction amid a modest USD pullback from a multi-month top. (Pivot Orderbook analysis)
…
This is a premium post.
[s2If !current_user_can(access_s2member_level4)]Please register for PREMIUM VERSION HERE to read full post below containing analysis. In case of any error or you think you are not able to read the full post below, please email us at support#nehcap.com [lwa][/s2If] [s2If current_user_can(access_s2member_level4)]
- NZD/USD gains strong positive traction amid a modest USD pullback from a multi-month top.
- Bets for a 50 bps Fed rate hike in March should help limit the USD losses and act as a headwind.
- Looming recession risks could also contribute to capping the upside for the risk-sensitive Kiwi.
The pair currently trades last at 0.61312.
The previous day high was 0.6139 while the previous day low was 0.6084. The daily 38.2% Fib levels comes at 0.6105, expected to provide support. Similarly, the daily 61.8% fib level is at 0.6118, expected to provide support.
The NZD/USD pair attracts some buyers on Thursday and moves away from its lowest level since mid-November, around the 0.6085 region touched the previous day. The momentum lifts spot prices to a two-day high, closer to mid-0.6100s heading into the North American session, and is sponsored by a modest US Dollar weakness.
Signs of stability around the equity markets prompt traders to take some profits and lighten their bullish bets around the safe-haven Greenback, which, in turn, is seen benefitting the risk-sensitive Kiwi. That said, looming recession fears, along with fading hopes over a strong economic recovery in China, should keep a lid on any optimism in the markets. Apart from this, expectations for more aggressive policy tightening by the Federal Reserve should act as a tailwind for the buck and contribute to capping the upside for the NZD/USD pair.
In fact, investors started pricing in a greater chance of a jumbo 50 bps lift-off at the March FOMC meeting after Fed Chair Jerome Powell said that interest rates would have to go higher and possibly faster to tame stubbornly high inflation. This is evident from elevated US Treasury bond yields and favours the USD bulls. The market sentiment, meanwhile, remains fragile amid growing worries about economic headwinds stemming from rapidly rising borrowing costs, which adds credence to the near-term positive outlook for the Greenback.
The aforementioned fundamental backdrop suggests that the path of least resistance for the NZD/USD pair is to the downside. Hence, any subsequent move up might still be seen as a selling opportunity and runs the risk of fizzling out rather quickly. Next on tap is the release of the usual Weekly Initial Jobless Claims data from the US. This, along with the US bond yields and the broader risk sentiment, should influence the USD price dynamics and provide some impetus to the NZD/USD pair ahead of the crucial NFP report on Friday.
Technical Levels: Supports and Resistances
NZDUSD currently trading at 0.6132 at the time of writing. Pair opened at 0.6113 and is trading with a change of 0.31 % .
| Overview | Overview.1 | |
|---|---|---|
| 0 | Today last price | 0.6132 |
| 1 | Today Daily Change | 0.0019 |
| 2 | Today Daily Change % | 0.3100 |
| 3 | Today daily open | 0.6113 |
The pair remains strongly bearish on the daily time frame. It trades below the 20 SMA @ 0.6233, 50 SMA 0.6328, 100 SMA @ 0.6232 and 200 SMA @ 0.6172.
| Trends | Trends.1 | |
|---|---|---|
| 0 | Daily SMA20 | 0.6233 |
| 1 | Daily SMA50 | 0.6328 |
| 2 | Daily SMA100 | 0.6232 |
| 3 | Daily SMA200 | 0.6172 |
The previous day high was 0.6139 while the previous day low was 0.6084. The daily 38.2% Fib levels comes at 0.6105, expected to provide support. Similarly, the daily 61.8% fib level is at 0.6118, expected to provide support.
Note the levels of interest below:
- Pivot support is noted at 0.6085, 0.6057, 0.603
- Pivot resistance is noted at 0.614, 0.6167, 0.6195
| Levels | Levels.1 |
|---|---|
| Previous Daily High | 0.6139 |
| Previous Daily Low | 0.6084 |
| Previous Weekly High | 0.6277 |
| Previous Weekly Low | 0.6131 |
| Previous Monthly High | 0.6538 |
| Previous Monthly Low | 0.6131 |
| Daily Fibonacci 38.2% | 0.6105 |
| Daily Fibonacci 61.8% | 0.6118 |
| Daily Pivot Point S1 | 0.6085 |
| Daily Pivot Point S2 | 0.6057 |
| Daily Pivot Point S3 | 0.6030 |
| Daily Pivot Point R1 | 0.6140 |
| Daily Pivot Point R2 | 0.6167 |
| Daily Pivot Point R3 | 0.6195 |
[/s2If]
Join Our Telegram Group
")


