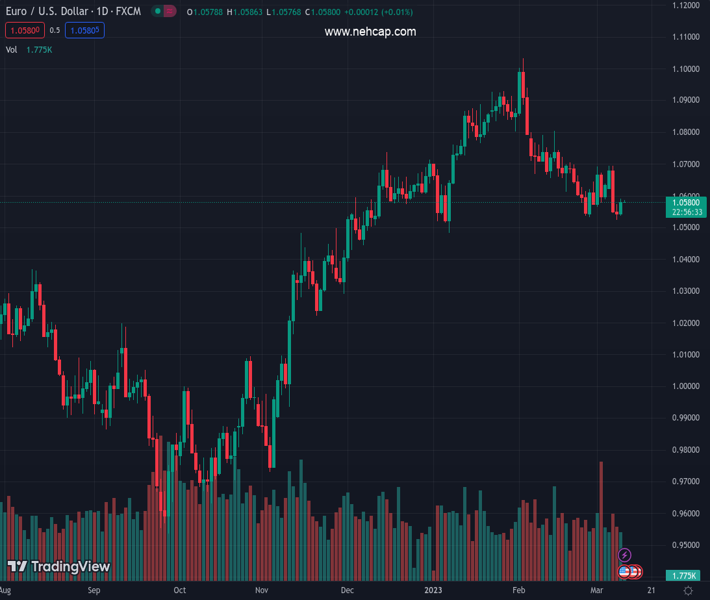
#EURUSD @ 1.05815 is facing selling pressure in extending its recovery above the supply zone placed in a range of 1.0577-1.0589. (Pivot Orderbook analysis)
…
This is a premium post.
[s2If !current_user_can(access_s2member_level4)]Please register for PREMIUM VERSION HERE to read full post below containing analysis. In case of any error or you think you are not able to read the full post below, please email us at support#nehcap.com [lwa][/s2If] [s2If current_user_can(access_s2member_level4)]
- EUR/USD is facing selling pressure in extending its recovery above the supply zone placed in a range of 1.0577-1.0589.
- An absence of strength in the recovery move from EUR/USD has kept the room open for bears.
- The RSI (14) is struggling to sustain in the bullish range of 60.00-80.00.
The pair currently trades last at 1.05815.
The previous day high was 1.0574 while the previous day low was 1.0524. The daily 38.2% Fib levels comes at 1.0543, expected to provide support. Similarly, the daily 61.8% fib level is at 1.0555, expected to provide support.
The EUR/USD pair has scaled above 1.0580 in the early Tokyo session despite a lack of strength in the recovery move. It seems that investors are putting less focus on building positions as the release of the United States Nonfarm payrolls (NFP) (Feb) data will provide more clarity on further guidance.
According to the estimates, the United States economy has added fresh 205K jobs, lower than the mega addition of 514K payrolls in January. The Unemployment Rate is expected to remain steady at 3.4%. The catalyst that might grab major attention is the Average Hourly Earnings data. Firms are offering higher payouts to hire fresh talent amid an extreme shortage of labor. And higher payouts are forcing households to stretch their spending, which is ultimately fueling the US Consumer Price Index (CPI). The economic data is seen higher at 4.7% vs. the former release of 4.4%.
The US Dollar Index (DXY) is oscillating above 105.20 after a gradual correction. A release of an upbeat US NFP gamut might strengthen US Dollar bulls further.
EUR/USD is facing selling pressure in extending its recovery above the supply zone in a range of 1.0577-1.0589 on an hourly scale. The 100-period Exponential Moving Average (EMA) at 1.0585 also acts as a barricade for the Euro.
Meanwhile, the Relative Strength Index (RSI) (14) is struggling to sustain in the bullish range of 60.00-80.00. An absence of strength in the RSI (14) could result in exhaustion in the uptrend.
A break below March 01 low at 1.0565 might drag the major currency pair toward March 08 low at 1.0524. A slippage below the same will drag the asset further toward the psychological support at 1.0500.
On the flip side, a decisive move above the round-level resistance at 1.0600 will drive the asset toward February 28 high at 1.0645. A breach above the latter will expose the asset to March 01 high at 1.0691.
Technical Levels: Supports and Resistances
EURUSD currently trading at 1.0583 at the time of writing. Pair opened at 1.0548 and is trading with a change of 0.33 % .
| Overview | Overview.1 | |
|---|---|---|
| 0 | Today last price | 1.0583 |
| 1 | Today Daily Change | 0.0035 |
| 2 | Today Daily Change % | 0.3300 |
| 3 | Today daily open | 1.0548 |
The pair is trading below its 20 Daily moving average @ 1.0644, below its 50 Daily moving average @ 1.0725 , above its 100 Daily moving average @ 1.0519 and above its 200 Daily moving average @ 1.0327
| Trends | Trends.1 | |
|---|---|---|
| 0 | Daily SMA20 | 1.0644 |
| 1 | Daily SMA50 | 1.0725 |
| 2 | Daily SMA100 | 1.0519 |
| 3 | Daily SMA200 | 1.0327 |
The previous day high was 1.0574 while the previous day low was 1.0524. The daily 38.2% Fib levels comes at 1.0543, expected to provide support. Similarly, the daily 61.8% fib level is at 1.0555, expected to provide support.
Note the levels of interest below:
- Pivot support is noted at 1.0523, 1.0499, 1.0474
- Pivot resistance is noted at 1.0573, 1.0598, 1.0622
| Levels | Levels.1 |
|---|---|
| Previous Daily High | 1.0574 |
| Previous Daily Low | 1.0524 |
| Previous Weekly High | 1.0692 |
| Previous Weekly Low | 1.0533 |
| Previous Monthly High | 1.1033 |
| Previous Monthly Low | 1.0533 |
| Daily Fibonacci 38.2% | 1.0543 |
| Daily Fibonacci 61.8% | 1.0555 |
| Daily Pivot Point S1 | 1.0523 |
| Daily Pivot Point S2 | 1.0499 |
| Daily Pivot Point S3 | 1.0474 |
| Daily Pivot Point R1 | 1.0573 |
| Daily Pivot Point R2 | 1.0598 |
| Daily Pivot Point R3 | 1.0622 |
[/s2If]
Join Our Telegram Group
")


