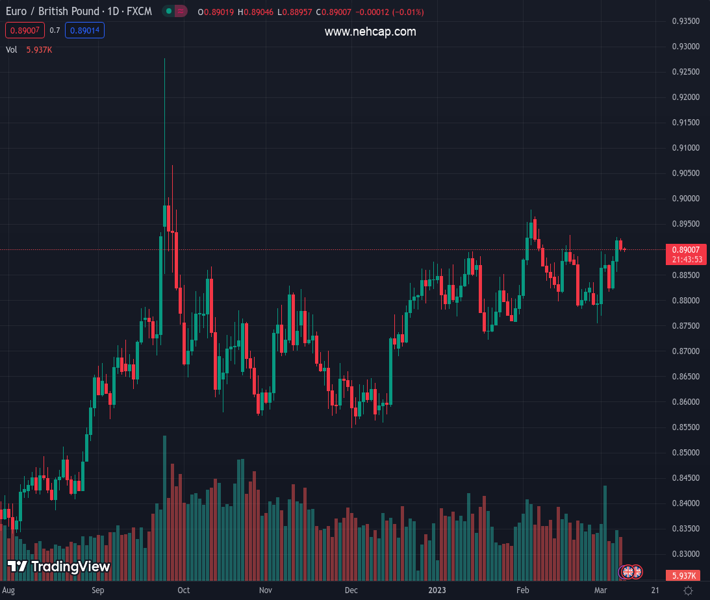
#EURGBP @ 0.89016 is built a cushion around 0.8900 amid rising odds of a steady BoE policy. (Pivot Orderbook analysis)
…
This is a premium post.
[s2If !current_user_can(access_s2member_level4)]Please register for PREMIUM VERSION HERE to read full post below containing analysis. In case of any error or you think you are not able to read the full post below, please email us at support#nehcap.com [lwa][/s2If] [s2If current_user_can(access_s2member_level4)]
- EUR/GBP is built a cushion around 0.8900 amid rising odds of a steady BoE policy.
- A breakout of the Descending Triangle has already underpinned the Euro against the Pound Sterling.
- Upside momentum is still active as the RSI (14) has not surrendered the bullish range yet.
The pair currently trades last at 0.89016.
The previous day high was 0.8922 while the previous day low was 0.8896. The daily 38.2% Fib levels comes at 0.8906, expected to provide resistance. Similarly, the daily 61.8% fib level is at 0.8912, expected to provide resistance.
The EUR/GBP pair has gauged an intermediate cushion around 0.8900 in the Asian session. The cross has been consolidating in a 20-pip range from the past two trading sessions. The upside bias for the pair looks favored as expectations for a steady Bank of England (BoE) monetary policy are solidifying.
A forecast from the British Chambers of Commerce (BCC) that “The country’s economy is on track to shrink less than expected this year and avoid two quarters of negative growth which mark a technical recession,” reported by Reuters, is bolstering the fact that the BoE could consider a halt in the policy-tightening spree.
Also, BoE policymaker Swati Dhingra warned on Wednesday “Overtightening poses a more material risk at this point.” A pause in BoE’s policy restriction might have a negative impact on the Pound Sterling.
Meanwhile, the European Central Bank (ECB) is set on its path of contracting monetary policy as expectations of a rebound in Eurozone inflation are improving.
On a four-hour scale, the cross has delivered a breakout of the Descending triangle chart pattern, which indicates an expansion in volatility after a sheer squeeze in the same. The downward-sloping trendline of the chart pattern is plotted from February 03 high at 0.8979 while the horizontal support is placed from January 30 low at 0.8766.
The 20-period Exponential Moving Average (EMA) at 0.8893 is providing a cushion to the Euro bulls.
Meanwhile, the Relative Strength Index (RSI) (14) has not surrendered the bullish range of 60.00-80.00 yet, which indicates that the upside momentum is still active.
Should the cross breaks above February 17 high at 0.8929, Euro bulls will drive the asset towards February 3 high at 0.8979 followed by the psychological support at 0.9000.
On the flip side, a breakdown below February 14 low at 0.8804 will expose the asset to January 29 low at 0.8763 and January 19 low at 0.8722.
Technical Levels: Supports and Resistances
EURGBP currently trading at 0.8903 at the time of writing. Pair opened at 0.8902 and is trading with a change of 0.01 % .
| Overview | Overview.1 | |
|---|---|---|
| 0 | Today last price | 0.8903 |
| 1 | Today Daily Change | 0.0001 |
| 2 | Today Daily Change % | 0.0100 |
| 3 | Today daily open | 0.8902 |
The pair remains strongly bullish on the daily timeframe. It trades above its 20 SMA @ 0.8851, 50 SMA 0.884, 100 SMA @ 0.8763 and 200 SMA @ 0.8675.
| Trends | Trends.1 | |
|---|---|---|
| 0 | Daily SMA20 | 0.8851 |
| 1 | Daily SMA50 | 0.8840 |
| 2 | Daily SMA100 | 0.8763 |
| 3 | Daily SMA200 | 0.8675 |
The previous day high was 0.8922 while the previous day low was 0.8896. The daily 38.2% Fib levels comes at 0.8906, expected to provide resistance. Similarly, the daily 61.8% fib level is at 0.8912, expected to provide resistance.
Note the levels of interest below:
- Pivot support is noted at 0.8891, 0.8881, 0.8865
- Pivot resistance is noted at 0.8917, 0.8933, 0.8943
| Levels | Levels.1 |
|---|---|
| Previous Daily High | 0.8922 |
| Previous Daily Low | 0.8896 |
| Previous Weekly High | 0.8897 |
| Previous Weekly Low | 0.8755 |
| Previous Monthly High | 0.8979 |
| Previous Monthly Low | 0.8755 |
| Daily Fibonacci 38.2% | 0.8906 |
| Daily Fibonacci 61.8% | 0.8912 |
| Daily Pivot Point S1 | 0.8891 |
| Daily Pivot Point S2 | 0.8881 |
| Daily Pivot Point S3 | 0.8865 |
| Daily Pivot Point R1 | 0.8917 |
| Daily Pivot Point R2 | 0.8933 |
| Daily Pivot Point R3 | 0.8943 |
[/s2If]
Join Our Telegram Group
")


