DXY comes under some selling pressure following new YTD highs. (Pivot Orderbook analysis)
…
This is a premium post.
[s2If !current_user_can(access_s2member_level4)]Please register for PREMIUM VERSION HERE to read full post below containing analysis. In case of any error or you think you are not able to read the full post below, please email us at support#nehcap.com [lwa][/s2If] [s2If current_user_can(access_s2member_level4)]
- DXY comes under some selling pressure following new YTD highs.
- Extra upside continues to target the 200-day SMA.
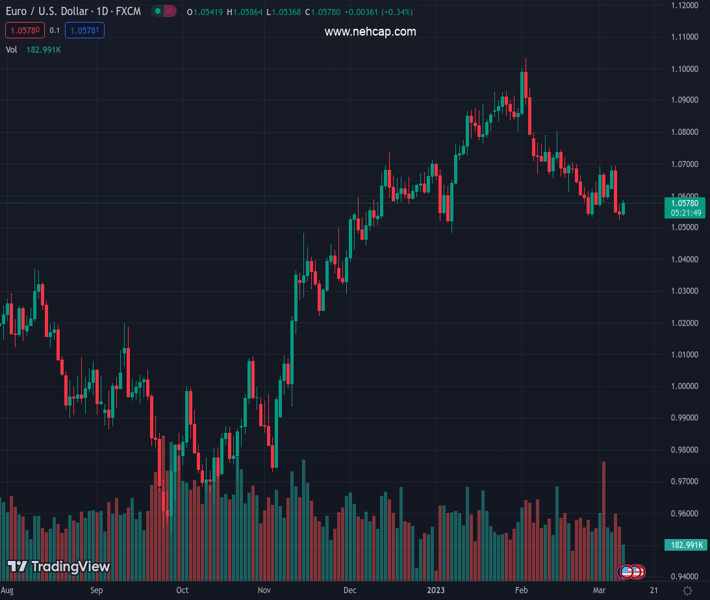
The pair currently trades last at 105.43.
The previous day high was 105.89 while the previous day low was 105.35. The daily 38.2% Fib levels comes at 105.68, expected to provide resistance. Similarly, the daily 61.8% fib level is at 105.56, expected to provide resistance.
DXY gives away part of recent gains to the vicinity of the 106.00 mark, or new 2023 peaks.
The continuation of the rebound in the dollar seems like for the time being. The breakout of the round level at 106.00 should put the index en route to a probable test of the key 200-day SMA, today at 106.60.
A convincing move beyond the latter should shift the outlook to constructive in the short-term horizon and allow for the continuation of the uptrend.
Technical Levels: Supports and Resistances
EURUSD currently trading at 105.43 at the time of writing. Pair opened at 105.7 and is trading with a change of -0.26 % .
| Overview | Overview.1 | |
|---|---|---|
| 0 | Today last price | 105.43 |
| 1 | Today Daily Change | 49.00 |
| 2 | Today Daily Change % | -0.26 |
| 3 | Today daily open | 105.70 |
The pair is trading above its 20 Daily moving average @ 104.33, above its 50 Daily moving average @ 103.43 , above its 100 Daily moving average @ 104.74 and below its 200 Daily moving average @ 106.84
| Trends | Trends.1 | |
|---|---|---|
| 0 | Daily SMA20 | 104.33 |
| 1 | Daily SMA50 | 103.43 |
| 2 | Daily SMA100 | 104.74 |
| 3 | Daily SMA200 | 106.84 |
The previous day high was 105.89 while the previous day low was 105.35. The daily 38.2% Fib levels comes at 105.68, expected to provide resistance. Similarly, the daily 61.8% fib level is at 105.56, expected to provide resistance.
Note the levels of interest below:
- Pivot support is noted at 105.4, 105.11, 104.87
- Pivot resistance is noted at 105.94, 106.18, 106.47
| Levels | Levels.1 |
|---|---|
| Previous Daily High | 105.89 |
| Previous Daily Low | 105.35 |
| Previous Weekly High | 105.36 |
| Previous Weekly Low | 104.09 |
| Previous Monthly High | 105.36 |
| Previous Monthly Low | 100.81 |
| Daily Fibonacci 38.2% | 105.68 |
| Daily Fibonacci 61.8% | 105.56 |
| Daily Pivot Point S1 | 105.40 |
| Daily Pivot Point S2 | 105.11 |
| Daily Pivot Point S3 | 104.87 |
| Daily Pivot Point R1 | 105.94 |
| Daily Pivot Point R2 | 106.18 |
| Daily Pivot Point R3 | 106.47 |
[/s2If]
Join Our Telegram Group
")


