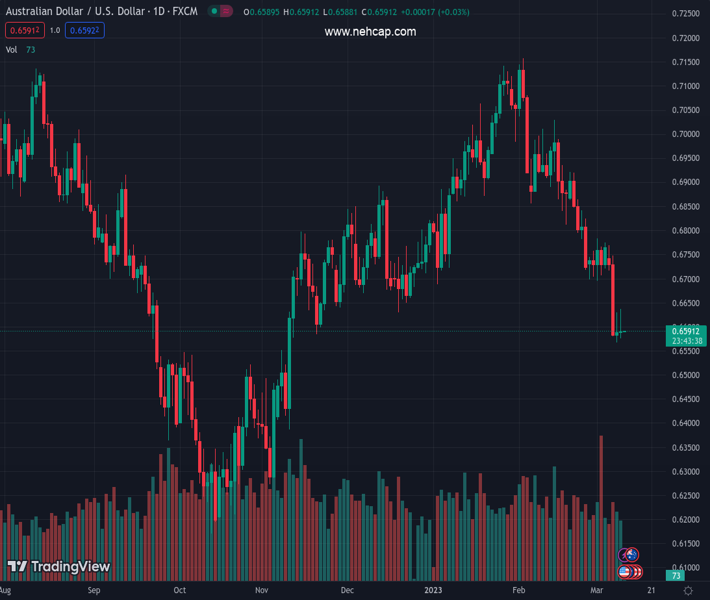
#AUDUSD @ 0.65902 fails to recover from four-month trough, holds lower ground of late. (Pivot Orderbook analysis)
…
This is a premium post.
[s2If !current_user_can(access_s2member_level4)]Please register for PREMIUM VERSION HERE to read full post below containing analysis. In case of any error or you think you are not able to read the full post below, please email us at support#nehcap.com [lwa][/s2If] [s2If current_user_can(access_s2member_level4)]
- AUD/USD fails to recover from four-month trough, holds lower ground of late.
- Global markets remained vulnerable on mixed US data amid cautious mood ahead of NFP.
- Downbeat China inflation, US President Biden’s budget proposal also strengthens risk-off mood.
- Equities drop but a retreat in yields weigh on US Dollar despite sour sentiment.
The pair currently trades last at 0.65902.
The previous day high was 0.6629 while the previous day low was 0.6568. The daily 38.2% Fib levels comes at 0.6606, expected to provide resistance. Similarly, the daily 61.8% fib level is at 0.6591, expected to provide resistance.
AUD/USD justifies its risk-barometer status while revisiting the sub-0.6600 area early Friday, after a failed attempt to recover from the four-month low. In doing so, the Aussie pair traces the downbeat equities and fears emanating from China, as well as failing to cheer the retreat in the US Treasury bond yield and the US Dollar, amid the market’s cautious mood ahead of the all-important US employment data.
Wall Street benchmarks closed with more than 1.5% daily losses each but the US 10-year and two-year Treasury bond yields eased to 3.92% and 4.87% versus 5.08% and 4.01% daily open respectively. It should be noted that the US Dollar Index (DXY) managed to pare some of the daily losses by the end of Thursday but failed to ignore the biggest daily fall in a week.
While tracing the key catalysts mixed employment clues from the US gain major attention. That said, US Initial Jobless Claims marked the biggest jump since January by rising to 211K for the week ended on March 03 versus 195K expected and 190K prior. Additionally, the Challenger Job Cuts were down and the Continuing Jobless Claims were up.
Elsewhere, disappointment from China’s monthly Consumer Price Index (CPI) and Producer Price Index (PPI) data for February also dims the prospects of recovery in the world’s second-largest economy and weighs on the risk profile. On the same line could be the fears of higher taxes in the world’s biggest economy, the US, as well as the political chaos relating to it as US President Joe Biden proposes raising corporation tax from 21% to 28% in his latest budget guide ahead of Friday’s release.
Above all, hawkish comments from Fed Chair Jerome Powell join dovish rhetoric from Reserve Bank of Australia (RBA) Governor Philip Lowe to keep the AUD/USD bears hopeful as traders await the key US Nonfarm Payrolls, expected 205K versus 517K prior.
Given the mixed early clues and the strong prints in the last, fewer odds favor the positive surprise from the US jobs report and hence the AUD/USD pair may witness a corrective bounce. The hopes of recovery also take clues from the quote’s repeated failure to drop below 0.6550.
AUD/USD dribbles inside a 100-pip trading range between 0.6640 and 0.6540 comprising levels marked during late October and November 2022.
Technical Levels: Supports and Resistances
AUDUSD currently trading at 0.659 at the time of writing. Pair opened at 0.6594 and is trading with a change of -0.06% % .
| Overview | Overview.1 | |
|---|---|---|
| 0 | Today last price | 0.659 |
| 1 | Today Daily Change | -0.0004 |
| 2 | Today Daily Change % | -0.06% |
| 3 | Today daily open | 0.6594 |
The pair remains strongly bearish on the daily time frame. It trades below the 20 SMA @ 0.6811, 50 SMA 0.6893, 100 SMA @ 0.676 and 200 SMA @ 0.6784.
| Trends | Trends.1 | |
|---|---|---|
| 0 | Daily SMA20 | 0.6811 |
| 1 | Daily SMA50 | 0.6893 |
| 2 | Daily SMA100 | 0.6760 |
| 3 | Daily SMA200 | 0.6784 |
The previous day high was 0.6629 while the previous day low was 0.6568. The daily 38.2% Fib levels comes at 0.6606, expected to provide resistance. Similarly, the daily 61.8% fib level is at 0.6591, expected to provide resistance.
Note the levels of interest below:
- Pivot support is noted at 0.6565, 0.6536, 0.6504
- Pivot resistance is noted at 0.6626, 0.6658, 0.6687
| Levels | Levels.1 |
|---|---|
| Previous Daily High | 0.6629 |
| Previous Daily Low | 0.6568 |
| Previous Weekly High | 0.6784 |
| Previous Weekly Low | 0.6695 |
| Previous Monthly High | 0.7158 |
| Previous Monthly Low | 0.6698 |
| Daily Fibonacci 38.2% | 0.6606 |
| Daily Fibonacci 61.8% | 0.6591 |
| Daily Pivot Point S1 | 0.6565 |
| Daily Pivot Point S2 | 0.6536 |
| Daily Pivot Point S3 | 0.6504 |
| Daily Pivot Point R1 | 0.6626 |
| Daily Pivot Point R2 | 0.6658 |
| Daily Pivot Point R3 | 0.6687 |
[/s2If]
Join Our Telegram Group
")


