WTI has dropped in the last two days 3% on speculations about future Federal Reserve rate hikes. (Pivot Orderbook analysis)
…
This is a premium post.
[s2If !current_user_can(access_s2member_level4)]Please register for PREMIUM VERSION HERE to read full post below containing analysis. In case of any error or you think you are not able to read the full post below, please email us at support#nehcap.com [lwa][/s2If] [s2If current_user_can(access_s2member_level4)]
- WTI has dropped in the last two days 3% on speculations about future Federal Reserve rate hikes.
- US crude oil inventories dropped, putting a lid on WTI’s fall.
- WTI Price Analysis: Further downside is expected below $74.00.
The pair currently trades last at 76.57.
The previous day high was 80.99 while the previous day low was 77.16. The daily 38.2% Fib levels comes at 78.62, expected to provide resistance. Similarly, the daily 61.8% fib level is at 79.52, expected to provide resistance.
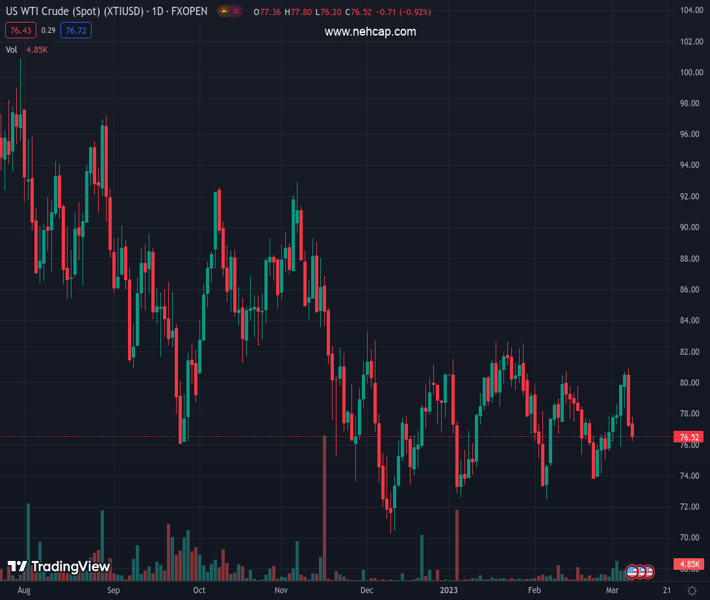
Western Texas Intermediate (WTI), the US crude oil benchmark, falls 0.93% as Federal Reserve’s (Fed) Chair Jerome Powell’s two-day testify in the US Congress ended. The aftermath leaves the US Dollar (USD) gaining, US Treasury bond yields up, and speculations for a 50 bps rate hike at the Fed’s upcoming meeting looming. At the time of typing, WTI is trading at $76.44 PB.
Oil prices extended its losses based on hawkish commentary by Fed Chief Jerome Powell, who said that rates would peak higher than expected and at a faster pace if needed. The greenback appreciated sharply and jumped more than 1%, spurring WTI’s 3% fall.
US crude oil inventories fell 1.7 million last week, exceeding estimates for a 395K drop, according to the US Energy Information Administration (EIA) agency.
Oil demand is expected to increase based on China’s reopening. Barclays lowered its WTI forecast from $94.00 a barrel to $87.00. “(We) expect the continued recovery in civil aviation demand in China and neighboring countries, a stabilization in industrial activity, and slower non-OPEC+ supply growth to drive the oil market balance into a deficit later this year,” Barclays analysts added.
At a Houston meeting, oil officials discussed how tight the supply was. Angola’s oil and gas chief said OPEC did not have to raise production to compensate for Russia’s half-a-million-barrel-per-day reduction.
WTI consolidates at around the $74.00-$78.00 range, with the 20 and 50-day Exponential Moving Averages (EMAs) overlapping against each other. Contrarily, the 100 and 200-day EMAs, at 80.31 and 83.90, respectively, hover above WTI’s spot price, maintaining the bias tilted downwards. Traders should know that the Relative Strength Index (RSI) shifted bearish while the Rate of Change (RoC) followed suit.
For a bearish continuation, WTI needs to clear $74.00. Once done, the next support would be the February 22 daily low at 73.83, followed by the February 6 low at 72.30, before testing the YTD low of $70.10. Conversely, WTI needs to clear the $77.51-$78.03 area, the confluence of the 20/50-day EMAs. A breach of that area will expose the 100-day EMA at $80.31.
Technical Levels: Supports and Resistances
XTIUSD currently trading at 76.57 at the time of writing. Pair opened at 77.49 and is trading with a change of -1.19 % .
| Overview | Overview.1 | |
|---|---|---|
| 0 | Today last price | 76.57 |
| 1 | Today Daily Change | -0.92 |
| 2 | Today Daily Change % | -1.19 |
| 3 | Today daily open | 77.49 |
The pair remains strongly bearish on the daily time frame. It trades below the 20 SMA @ 77.76, 50 SMA 78.0, 100 SMA @ 79.68 and 200 SMA @ 87.4.
| Trends | Trends.1 | |
|---|---|---|
| 0 | Daily SMA20 | 77.76 |
| 1 | Daily SMA50 | 78.00 |
| 2 | Daily SMA100 | 79.68 |
| 3 | Daily SMA200 | 87.40 |
The previous day high was 80.99 while the previous day low was 77.16. The daily 38.2% Fib levels comes at 78.62, expected to provide resistance. Similarly, the daily 61.8% fib level is at 79.52, expected to provide resistance.
Note the levels of interest below:
- Pivot support is noted at 76.1, 74.71, 72.27
- Pivot resistance is noted at 79.93, 82.38, 83.77
| Levels | Levels.1 |
|---|---|
| Previous Daily High | 80.99 |
| Previous Daily Low | 77.16 |
| Previous Weekly High | 79.93 |
| Previous Weekly Low | 75.05 |
| Previous Monthly High | 80.75 |
| Previous Monthly Low | 72.50 |
| Daily Fibonacci 38.2% | 78.62 |
| Daily Fibonacci 61.8% | 79.52 |
| Daily Pivot Point S1 | 76.10 |
| Daily Pivot Point S2 | 74.71 |
| Daily Pivot Point S3 | 72.27 |
| Daily Pivot Point R1 | 79.93 |
| Daily Pivot Point R2 | 82.38 |
| Daily Pivot Point R3 | 83.77 |
[/s2If]
Join Our Telegram Group
")


