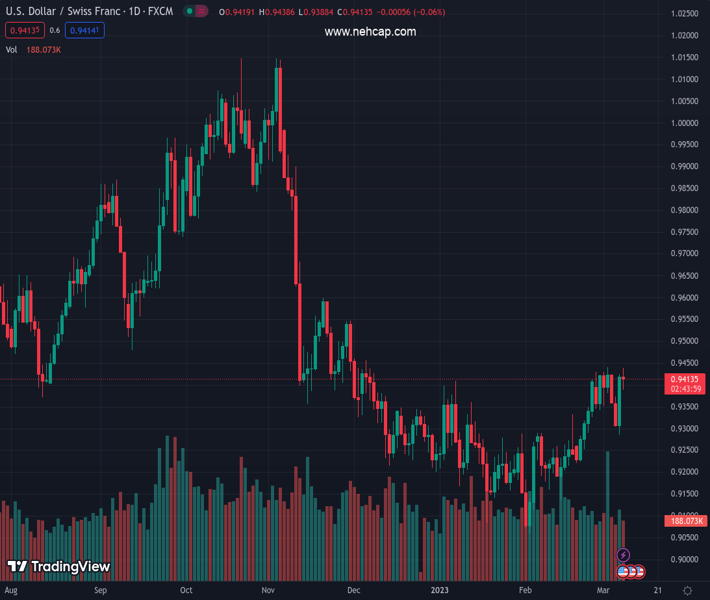
#USDCHF @ 0.94135 is almost flat, retraces 0.04% at around 0.9410s. (Pivot Orderbook analysis)
…
This is a premium post.
[s2If !current_user_can(access_s2member_level4)]Please register for PREMIUM VERSION HERE to read full post below containing analysis. In case of any error or you think you are not able to read the full post below, please email us at support#nehcap.com [lwa][/s2If] [s2If current_user_can(access_s2member_level4)]
- USD/CHF is almost flat, retraces 0.04% at around 0.9410s.
- A USD/CHF bullish continuation would trigger if the major cracks the 200-day EMA, with 0.9500 up for grabs.
- Otherwise, the USD/CHF falling below 0.9400 will expose the 100-day EMA.
The pair currently trades last at 0.94135.
The previous day high was 0.9425 while the previous day low was 0.9286. The daily 38.2% Fib levels comes at 0.9372, expected to provide support. Similarly, the daily 61.8% fib level is at 0.9339, expected to provide support.
The USD/CHF is firm above 0.9400, shy of the 200-day Exponential Moving Average (EMA), after rallying 1.21% on Tuesday. Also, it’s forming a doji around current exchange rates, trading at 0.9414 at the time of typing.
Wall Street continues to trade with losses. The US Federal Reserve Chair Jerome Powell continues to testify against the US Congress with a consistent hawkish tone. Therefore, the US Dollar (USD) consolidates yesterday’s gains, as shown by the US Dollar Index up 0.09%, at 105.710.
The USD/CHF remains sideways, trapped within the 100 and the 200-day EMAs, at 0.9384 and 0.9449, respectively. The Relative Strength Index (RSI) turned bullish, aimed north on Tuesday, indicating buyers are moving in. However, as of late turned flat, consistent with the USD/CHF price action. The Rate of Change (RoC) portrays buyers taking a breather before attempting to attack the 200-day EMA.
If the USD/CHF resumes upwards, the first resistance would be the 200-day EMA. A breach of the latter will send the pair rallying toward 0.9500. Once buyers reclaimed the 0.95 figure, the seller’s following line of defense would be the November 30 daily high at 0.9547. That could pave the way towards the November 21 high at 0.9598 before challenging 0.9600.
As an alternate scenario, the USD/CHF first demand area would be the 0.9400 psychological barriers, followed by the 100-day EMA at 0.9384. Once cleared, sellers could drag prices toward the 20-day EMA at 0.9331.
Technical Levels: Supports and Resistances
USDCHF currently trading at 0.9415 at the time of writing. Pair opened at 0.942 and is trading with a change of -0.05 % .
| Overview | Overview.1 | |
|---|---|---|
| 0 | Today last price | 0.9415 |
| 1 | Today Daily Change | -0.0005 |
| 2 | Today Daily Change % | -0.0500 |
| 3 | Today daily open | 0.9420 |
The pair is trading above its 20 Daily moving average @ 0.9304, above its 50 Daily moving average @ 0.9263 , below its 100 Daily moving average @ 0.9423 and below its 200 Daily moving average @ 0.9565
| Trends | Trends.1 | |
|---|---|---|
| 0 | Daily SMA20 | 0.9304 |
| 1 | Daily SMA50 | 0.9263 |
| 2 | Daily SMA100 | 0.9423 |
| 3 | Daily SMA200 | 0.9565 |
The previous day high was 0.9425 while the previous day low was 0.9286. The daily 38.2% Fib levels comes at 0.9372, expected to provide support. Similarly, the daily 61.8% fib level is at 0.9339, expected to provide support.
Note the levels of interest below:
- Pivot support is noted at 0.9329, 0.9238, 0.919
- Pivot resistance is noted at 0.9468, 0.9516, 0.9607
| Levels | Levels.1 |
|---|---|
| Previous Daily High | 0.9425 |
| Previous Daily Low | 0.9286 |
| Previous Weekly High | 0.9440 |
| Previous Weekly Low | 0.9342 |
| Previous Monthly High | 0.9429 |
| Previous Monthly Low | 0.9059 |
| Daily Fibonacci 38.2% | 0.9372 |
| Daily Fibonacci 61.8% | 0.9339 |
| Daily Pivot Point S1 | 0.9329 |
| Daily Pivot Point S2 | 0.9238 |
| Daily Pivot Point S3 | 0.9190 |
| Daily Pivot Point R1 | 0.9468 |
| Daily Pivot Point R2 | 0.9516 |
| Daily Pivot Point R3 | 0.9607 |
[/s2If]
Join Our Telegram Group
")


