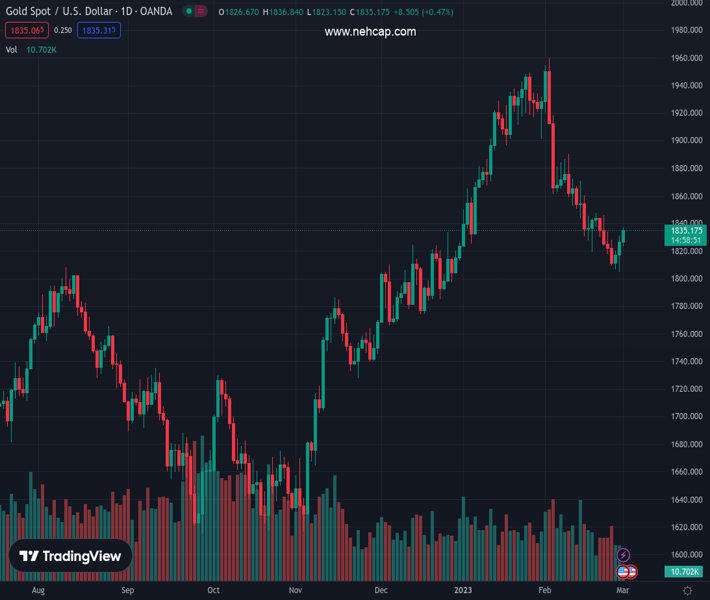
#XAUUSD @ 1,835.19 Gold price prints three-day uptrend, confirms technical breakout supporting further advances., @nehcap view: Limited upside expected (Pivot Orderbook analysis)
…
This is a premium post.
[s2If !current_user_can(access_s2member_level4)]Please register for PREMIUM VERSION HERE to read full post below containing analysis. In case of any error or you think you are not able to read the full post below, please email us at support#nehcap.com [lwa][/s2If] [s2If current_user_can(access_s2member_level4)]
- Gold price prints three-day uptrend, confirms technical breakout supporting further advances.
- Strong China PMIs favor risk-on mood as US Dollar retreats after posting the biggest monthly gain since September 2022.
- Hawkish Fed bias challenges XAU/USD upside before US S&P Global, ISM PMI figures for February.
The pair currently trades last at 1835.19.
The previous day high was 1831.23 while the previous day low was 1804.76. The daily 38.2% Fib levels comes at 1821.12, expected to provide support. Similarly, the daily 61.8% fib level is at 1814.87, expected to provide support.
Gold price (XAU/USD) begins March on a firmer footing as it refreshes intraday high near $1,835 during the three-day winning streak amid early Wednesday in Europe.
The metal’s latest run-up appears logical from both the fundamental, as well as technical, perspectives as China-linked news join the XAU/USD run-up beyond the $1,823 previous resistance.
That said, strong prints of China’s Caixin and NBS Manufacturing PMIs for February join the Non-Manufacturing PMI for the said month to mark an upbeat economic rebound in the world’s biggest industrial player, as well as one of the major Gold consumers. Following the data, China Finance Minister Liu He showed readiness to bolster the nation’s fiscal spending while also mentioning that the foundation of China’s economic recovery is still not stable.
Elsewhere, recently softer US data weighed on the US Dollar Index (DXY), which prints mild losses after the biggest monthly gains since September 2022 and allows the Gold buyers to keep the reins.
However, hawkish concerns surrounding the US Federal Reserve (Fed) and fears of more inflation crunch moving forward seem to keep a tab on the XAU/USD price.
While portraying the mood, S&P 500 Futures turn positive after initially tracking Wall Street’s mild losses but the US Treasury bond yields remain firmer at the latest.
Moving on, the US S&P Global and ISM PMI details for February will be important for immediate directions ahead of the next week’s key US jobs report. Above all, March’s Fed meeting and Chairman Jerome Powell’s testimony will be crucial for the Gold traders.
Gold price extends the previous day’s rebound from the 200-day Exponential Moving Average (EMA) to defy the three-week-old bearish channel. Adding strength to the recovery moves is the looming bull cross on the MACD and the RSI (14) rebound from the oversold territory.
With this, the XAU/USD appears well-set to aim for the 100-day EMA hurdle of $1,848.
However, the early February swing high of $1,890 will precede the $1,900 threshold and challenge the Gold buyers past $1,848.
Meanwhile, the XAU/USD pullback remains elusive unless the quote stays beyond the aforementioned bearish channel’s top line, close to $1,823 by the press time.
Following that, the 200-day EMA and the stated channel’s bottom line, around $1,804 and $1,784 in that order, appear important to confirm the bearish bias.
Trend: Limited upside expected
Technical Levels: Supports and Resistances
XAUUSD currently trading at 1834.74 at the time of writing. Pair opened at 1826.57 and is trading with a change of 0.45% % .
| Overview | Overview.1 | |
|---|---|---|
| 0 | Today last price | 1834.74 |
| 1 | Today Daily Change | 8.17 |
| 2 | Today Daily Change % | 0.45% |
| 3 | Today daily open | 1826.57 |
The pair is trading below its 20 Daily moving average @ 1853.82, below its 50 Daily moving average @ 1866.14 , above its 100 Daily moving average @ 1795.44 and above its 200 Daily moving average @ 1775.63
| Trends | Trends.1 | |
|---|---|---|
| 0 | Daily SMA20 | 1853.82 |
| 1 | Daily SMA50 | 1866.14 |
| 2 | Daily SMA100 | 1795.44 |
| 3 | Daily SMA200 | 1775.63 |
The previous day high was 1831.23 while the previous day low was 1804.76. The daily 38.2% Fib levels comes at 1821.12, expected to provide support. Similarly, the daily 61.8% fib level is at 1814.87, expected to provide support.
Note the levels of interest below:
- Pivot support is noted at 1810.48, 1794.38, 1784.01
- Pivot resistance is noted at 1836.95, 1847.32, 1863.42
| Levels | Levels.1 |
|---|---|
| Previous Daily High | 1831.23 |
| Previous Daily Low | 1804.76 |
| Previous Weekly High | 1847.59 |
| Previous Weekly Low | 1808.99 |
| Previous Monthly High | 1959.80 |
| Previous Monthly Low | 1804.76 |
| Daily Fibonacci 38.2% | 1821.12 |
| Daily Fibonacci 61.8% | 1814.87 |
| Daily Pivot Point S1 | 1810.48 |
| Daily Pivot Point S2 | 1794.38 |
| Daily Pivot Point S3 | 1784.01 |
| Daily Pivot Point R1 | 1836.95 |
| Daily Pivot Point R2 | 1847.32 |
| Daily Pivot Point R3 | 1863.42 |
[/s2If]
Join Our Telegram Group
")


