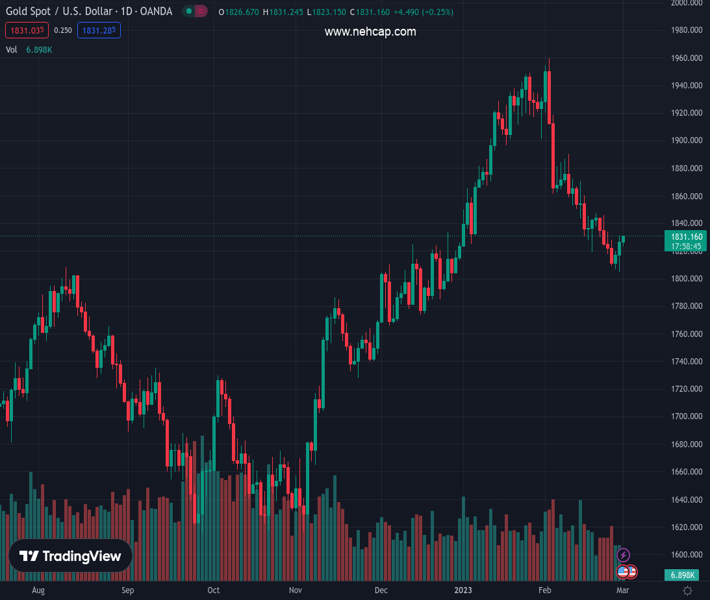
#XAUUSD @ 1,830.99 Gold price is aiming to shift its business above $1,830.00 as investors shrug off hawkish Fed-inspired volatility. (Pivot Orderbook analysis)
…
This is a premium post.
[s2If !current_user_can(access_s2member_level4)]Please register for PREMIUM VERSION HERE to read full post below containing analysis. In case of any error or you think you are not able to read the full post below, please email us at support#nehcap.com [lwa][/s2If] [s2If current_user_can(access_s2member_level4)]
- Gold price is aiming to shift its business above $1,830.00 as investors shrug off hawkish Fed-inspired volatility.
- An upbeat Caixin Manufacturing PMI has infused fresh blood into the risk-sensitive assets.
- A surprise decline in the US PMI figures could impact the strong labor market.
The pair currently trades last at 1830.99.
The previous day high was 1831.23 while the previous day low was 1804.76. The daily 38.2% Fib levels comes at 1821.12, expected to provide support. Similarly, the daily 61.8% fib level is at 1814.87, expected to provide support.
Gold price (XAU/USD) has rebounded firmly above $1,830.00 in the Asian session and is aiming to shift its auction above the same. The precious metal has picked strength as investors’ risk appetite has improved after the release of the upbeat Caixin Manufacturing PMI data. Investors have cheered the strong performance of the Chinese manufacturing sector as it indicates that the economy is effectively on the path of economic recovery after dismantling pandemic controls.
S&P500 futures have recovered the majority of the losses reported in the Asian session. The US Dollar Index (DXY) has refreshed its day low at 104.57 as investors are turning a deaf ear to the fears associated with higher rates expectations from the Federal Reserve (Fed). The demand for US government bonds still looks gloomy as the return on 10-year US Treasuries is solid at 3.94%.
Wednesday’s session is going to be full of action as the United States Institute of Supply Management (ISM) will report February’s Manufacturing PMI. The economic data is seen at 48.0 lower than the former release of 47.4. The Manufacturing PMI has been contracting consecutively for the past three months as a figure below 50.0 is itself considered a contraction. A surprise decline in the PMI figures could impact the strong US labor market and lay-off could be witnessed ahead.
Gold price has rebounded after testing the breakout of the Falling Channel chart pattern formed on an hourly scale. The precious metal is expected to display a sheer upside move as a bullish reversal has been confirmed after exploding the aforementioned chart pattern on the upside.
The Relative Strength Index (RSI) (14) has delivered a range shift move from the 40.00-60.00 dimension to the bullish vault of 60.00-80.00, which advocates more upside ahead.
Technical Levels: Supports and Resistances
XAUUSD currently trading at 1830.3 at the time of writing. Pair opened at 1826.57 and is trading with a change of 0.2 % .
| Overview | Overview.1 | |
|---|---|---|
| 0 | Today last price | 1830.30 |
| 1 | Today Daily Change | 3.73 |
| 2 | Today Daily Change % | 0.20 |
| 3 | Today daily open | 1826.57 |
The pair is trading below its 20 Daily moving average @ 1853.82, below its 50 Daily moving average @ 1866.14 , above its 100 Daily moving average @ 1795.44 and above its 200 Daily moving average @ 1775.63
| Trends | Trends.1 | |
|---|---|---|
| 0 | Daily SMA20 | 1853.82 |
| 1 | Daily SMA50 | 1866.14 |
| 2 | Daily SMA100 | 1795.44 |
| 3 | Daily SMA200 | 1775.63 |
The previous day high was 1831.23 while the previous day low was 1804.76. The daily 38.2% Fib levels comes at 1821.12, expected to provide support. Similarly, the daily 61.8% fib level is at 1814.87, expected to provide support.
Note the levels of interest below:
- Pivot support is noted at 1810.48, 1794.38, 1784.01
- Pivot resistance is noted at 1836.95, 1847.32, 1863.42
| Levels | Levels.1 |
|---|---|
| Previous Daily High | 1831.23 |
| Previous Daily Low | 1804.76 |
| Previous Weekly High | 1847.59 |
| Previous Weekly Low | 1808.99 |
| Previous Monthly High | 1959.80 |
| Previous Monthly Low | 1804.76 |
| Daily Fibonacci 38.2% | 1821.12 |
| Daily Fibonacci 61.8% | 1814.87 |
| Daily Pivot Point S1 | 1810.48 |
| Daily Pivot Point S2 | 1794.38 |
| Daily Pivot Point S3 | 1784.01 |
| Daily Pivot Point R1 | 1836.95 |
| Daily Pivot Point R2 | 1847.32 |
| Daily Pivot Point R3 | 1863.42 |
[/s2If]
Join Our Telegram Group
")


