WTI crude oil rises for the second consecutive day, renews intraday high of late. (Pivot Orderbook analysis)
…
This is a premium post.
[s2If !current_user_can(access_s2member_level4)]Please register for PREMIUM VERSION HERE to read full post below containing analysis. In case of any error or you think you are not able to read the full post below, please email us at support#nehcap.com [lwa][/s2If] [s2If current_user_can(access_s2member_level4)]
- WTI crude oil rises for the second consecutive day, renews intraday high of late.
- Strong China PMI data bolster upbeat expectations from the world’s largest commodity user.
- Higher OPEC+ supplies, talks of more Russian Oil floating un-bid challenge WTI bulls.
- Fears of higher rates, inflation also keep a tab on energy benchmark ahead of US PMIs, official Oil inventories.
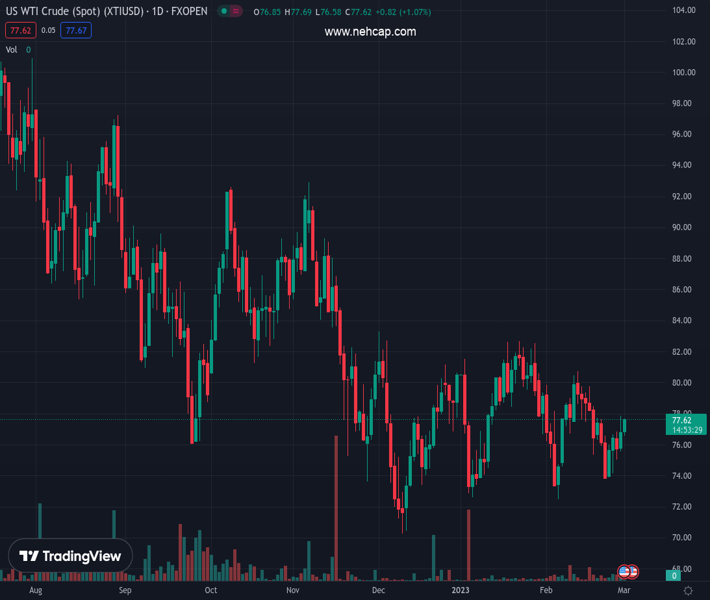
The pair currently trades last at 77.62.
The previous day high was 77.87 while the previous day low was 75.6. The daily 38.2% Fib levels comes at 77.0, expected to provide support. Similarly, the daily 61.8% fib level is at 76.47, expected to provide support.
WTI crude oil renews its intraday high around $77.60 during the initial hour of Wednesday’s European session.
In doing so, the black gold marks another attempt to regain the $78.00 after the previous day’s pullback from a one-week high.
That said, the energy benchmark’s previous pullback could be linked to the US Dollar’s run-up amid hawkish Fed bets, as well as inflation fears, while the fears of more Oil supplies joined the force to challenge the commodity bulls afterward.
It’s worth mentioning that talks of higher supplies from the OPEC+ group, comprising the Organization of the Petroleum Exporting Countries (OPEC) and allies led by Russia, despite binding to the output cut commitments, exert downside pressure on the black gold price. On the same line could be the news shared via Bloomberg that says, “As many as 1.9 million barrels of Russian diesel-type fuel is currently in floating storage, the most since October 2020.” The news also mentioned that this phenomenon indicates some cargoes loaded from Russian ports without buyers.
It should be noted, however, that the mixed US data and strong prints of China’s Caixin and NBS Manufacturing PMIs for February, as well as the Non-Manufacturing PMI for the said month, pushes back the hawkish Fed concerns and favor hopes of more demand from the world’s biggest commodity user.
Looking ahead, the US S&P Global and ISM PMI details for February will be important for immediate directions ahead of the weekly official Oil inventory data from the US Energy Information Administration (EIA).
A clear upside break of the 12-day-old descending trend line, previous resistance around $76.65, directs WTI crude oil buyers toward the 50-DMA hurdle of $78.00.
Technical Levels: Supports and Resistances
XTIUSD currently trading at 77.62 at the time of writing. Pair opened at 76.89 and is trading with a change of 0.95% % .
| Overview | Overview.1 | |
|---|---|---|
| 0 | Today last price | 77.62 |
| 1 | Today Daily Change | 0.73 |
| 2 | Today Daily Change % | 0.95% |
| 3 | Today daily open | 76.89 |
The pair is trading above its 20 Daily moving average @ 77.0, below its 50 Daily moving average @ 78.04 , below its 100 Daily moving average @ 80.01 and below its 200 Daily moving average @ 88.26
| Trends | Trends.1 | |
|---|---|---|
| 0 | Daily SMA20 | 77.00 |
| 1 | Daily SMA50 | 78.04 |
| 2 | Daily SMA100 | 80.01 |
| 3 | Daily SMA200 | 88.26 |
The previous day high was 77.87 while the previous day low was 75.6. The daily 38.2% Fib levels comes at 77.0, expected to provide support. Similarly, the daily 61.8% fib level is at 76.47, expected to provide support.
Note the levels of interest below:
- Pivot support is noted at 75.71, 74.52, 73.44
- Pivot resistance is noted at 77.97, 79.05, 80.24
| Levels | Levels.1 |
|---|---|
| Previous Daily High | 77.87 |
| Previous Daily Low | 75.60 |
| Previous Weekly High | 77.75 |
| Previous Weekly Low | 73.86 |
| Previous Monthly High | 80.75 |
| Previous Monthly Low | 72.50 |
| Daily Fibonacci 38.2% | 77.00 |
| Daily Fibonacci 61.8% | 76.47 |
| Daily Pivot Point S1 | 75.71 |
| Daily Pivot Point S2 | 74.52 |
| Daily Pivot Point S3 | 73.44 |
| Daily Pivot Point R1 | 77.97 |
| Daily Pivot Point R2 | 79.05 |
| Daily Pivot Point R3 | 80.24 |
[/s2If]
Join Our Telegram Group
")


