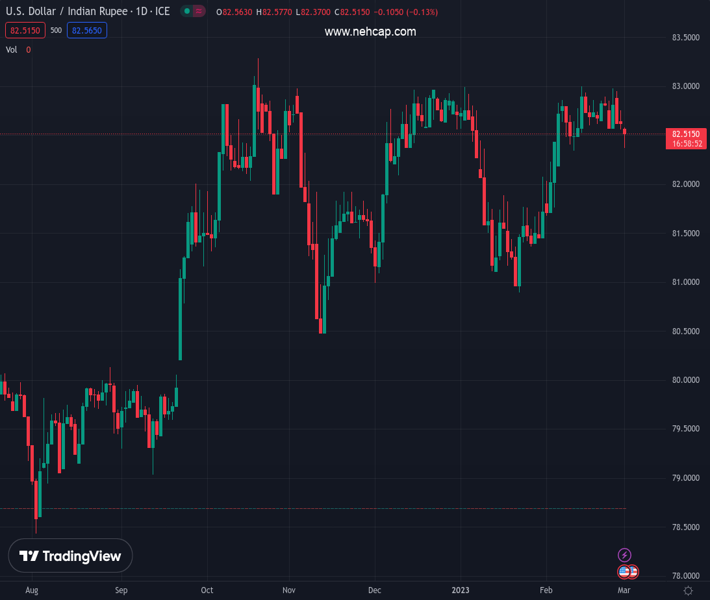
#USDINR @ 82.5390 has turned volatile as investors are discounting India’s weak GDP numbers. (Pivot Orderbook analysis)
…
This is a premium post.
[s2If !current_user_can(access_s2member_level4)]Please register for PREMIUM VERSION HERE to read full post below containing analysis. In case of any error or you think you are not able to read the full post below, please email us at support#nehcap.com [lwa][/s2If] [s2If current_user_can(access_s2member_level4)]
- USD/INR has turned volatile as investors are discounting India’s weak GDP numbers.
- India’s Q3 GDP has slipped lower to 4.4% from 6.3% and 13.5% figures recorded in Q2 and Q1 respectively.
- Upbeat Caixin Manufacturing PMI has improved investors’ risk appetite.
The pair currently trades last at 82.5390.
The previous day high was 82.7575 while the previous day low was 82.5544. The daily 38.2% Fib levels comes at 82.632, expected to provide resistance. Similarly, the daily 61.8% fib level is at 82.6799, expected to provide resistance.
The USD/INR pair has shown a recovery move after dropping firmly to near 82.35 in the Asian session. The asset is displaying volatility as investors are discounting overnight sell-off in the US Dollar Index (DXY). The major is prone to the downside as the risk-off impulse has faded after the release of the upbeat Caixin Manufacturing PMI data.
The US Dollar Index (DXY) has sensed support after printing a day low at 104.47. The corrective move in the USD Index is the outcome of disappearing fears of more rates announcement from the Federal Reserve (Fed). Meanwhile, the alpha generated on the US government bonds looks still solid. At the press time, the 10-year US Treasury yields are hovering around 3.94%.
S&P500 futures are on the verge of shrugging their entire losses reported in the Asian session, portraying a meaningful rebound in the risk appetite of the market participants.
A power-pack performance is expected from the USD Index amid the release of the United States ISM Manufacturing PMI data. According to the preliminary estimates, the economic data is seen at 48.0 from the former release of 47.4. Apart from that, the New Orders Index that conveys forward demand is expected to rebound to 43.7 from the prior figure of 42.5.
The Indian Rupee remained in action on Tuesday over the release of the Gross Domestic Product (GDP) Q3 data. Restrictive monetary policy by the Reserve Bank of India (RBI) in wake of achieving price stability has resulted in a slowdown in economic activities. The Q3 GDP has dropped to 4.4% in which crude oil output has dropped firmly by 1.1% on an annual basis. In the Q2 and Q1, GDP was measured at 6.3% and 13.5% respectively.
Technical Levels: Supports and Resistances
USDINR currently trading at 82.4805 at the time of writing. Pair opened at 82.6204 and is trading with a change of -0.17 % .
| Overview | Overview.1 | |
|---|---|---|
| 0 | Today last price | 82.4805 |
| 1 | Today Daily Change | -0.1399 |
| 2 | Today Daily Change % | -0.1700 |
| 3 | Today daily open | 82.6204 |
The pair is trading below its 20 Daily moving average @ 82.6302, above its 50 Daily moving average @ 82.2699 , above its 100 Daily moving average @ 82.1574 and above its 200 Daily moving average @ 80.809
| Trends | Trends.1 | |
|---|---|---|
| 0 | Daily SMA20 | 82.6302 |
| 1 | Daily SMA50 | 82.2699 |
| 2 | Daily SMA100 | 82.1574 |
| 3 | Daily SMA200 | 80.8090 |
The previous day high was 82.7575 while the previous day low was 82.5544. The daily 38.2% Fib levels comes at 82.632, expected to provide resistance. Similarly, the daily 61.8% fib level is at 82.6799, expected to provide resistance.
Note the levels of interest below:
- Pivot support is noted at 82.5307, 82.4411, 82.3277
- Pivot resistance is noted at 82.7338, 82.8472, 82.9368
| Levels | Levels.1 |
|---|---|
| Previous Daily High | 82.7575 |
| Previous Daily Low | 82.5544 |
| Previous Weekly High | 83.0256 |
| Previous Weekly Low | 82.5615 |
| Previous Monthly High | 83.0820 |
| Previous Monthly Low | 81.5032 |
| Daily Fibonacci 38.2% | 82.6320 |
| Daily Fibonacci 61.8% | 82.6799 |
| Daily Pivot Point S1 | 82.5307 |
| Daily Pivot Point S2 | 82.4411 |
| Daily Pivot Point S3 | 82.3277 |
| Daily Pivot Point R1 | 82.7338 |
| Daily Pivot Point R2 | 82.8472 |
| Daily Pivot Point R3 | 82.9368 |
[/s2If]
Join Our Telegram Group
")


