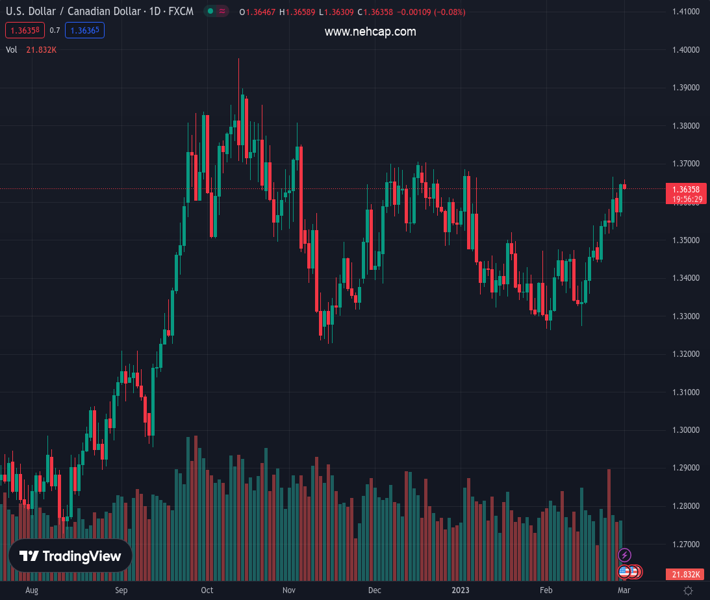
#USDCAD @ 1.36338 is struggling to extend gains above 1.3660 as USD Index corrects, upside bias still intact. (Pivot Orderbook analysis)
…
This is a premium post.
[s2If !current_user_can(access_s2member_level4)]Please register for PREMIUM VERSION HERE to read full post below containing analysis. In case of any error or you think you are not able to read the full post below, please email us at support#nehcap.com [lwa][/s2If] [s2If current_user_can(access_s2member_level4)]
- USD/CAD is struggling to extend gains above 1.3660 as USD Index corrects, upside bias still intact.
- The Canadian Dollar is facing immense offers after a downbeat Gross Domestic Product (GDP) (Q4) data.
- Oil prices are reviving firmly on upbeat Caixin Manufacturing PMI data.
The pair currently trades last at 1.36338.
The previous day high was 1.3646 while the previous day low was 1.3561. The daily 38.2% Fib levels comes at 1.3614, expected to provide support. Similarly, the daily 61.8% fib level is at 1.3593, expected to provide support.
The USD/CAD pair has sensed a halt in its upside momentum near 1.3660 in the Asian session. The upside momentum in the Loonie asset has cooled down a bit, however, the upside bias is still intact. The Loonie asset is expected to recapture the previous week’s high around 1.3665 as the US Dollar is getting strengthened further led by rising fears of further policy tightening by the Federal Reserve (Fed).
Losses have deepened by the S&P500 futures in the Asian session as the United States recession has come into the picture amid hawkish Fed bets. The US Dollar Index (DXY) has sensed barricades around 104.70, however, the risk aversion theme is still solid.
The yields offered on US treasury bonds have strengthened further as investors are expecting a mega rate hike from the Fed considering February’s economic indicators, which are promising a rebound in the inflationary pressures. The 10-year US Treasury yields have scaled to 3.94%, at the time of writing.
Meanwhile, the Canadian Dollar is facing immense offers after a downbeat Gross Domestic Product (GDP) (Q4) data. The annualized GDP remained flat lower than the expectations of 1.5% and the former release of 2.3%. While the monthly GDP (Dec) contracted by 0.1% vs. a flat consensus.
Flat GDP numbers might not be lucrative for Canada’s economic outlook but are favorable for the Bank of Canada (BoC), which is making efforts in bringing down persistent inflation. It is worth noting that BoC Governor Tiff Macklem has already paused the policy tightening spell after pushing rates to 4.5%, considering that the current monetary policy is restrictive enough to trim inflationary pressures for now.
On the oil front, oil prices have rebounded firmly after an upbeat China’s Caixin Manufacturing PMI data. The economic data has landed at 51.6, higher than the consensus of 50.2 and the former release of 49.2. It is worth noting that Canada is the leading exporter of oil to the United States and higher oil prices will strengthen the Canadian Dollar.
Technical Levels: Supports and Resistances
USDCAD currently trading at 1.3641 at the time of writing. Pair opened at 1.3646 and is trading with a change of -0.04 % .
| Overview | Overview.1 | |
|---|---|---|
| 0 | Today last price | 1.3641 |
| 1 | Today Daily Change | -0.0005 |
| 2 | Today Daily Change % | -0.0400 |
| 3 | Today daily open | 1.3646 |
The pair remains strongly bullish on the daily timeframe. It trades above its 20 SMA @ 1.3451, 50 SMA 1.346, 100 SMA @ 1.3508 and 200 SMA @ 1.3272.
| Trends | Trends.1 | |
|---|---|---|
| 0 | Daily SMA20 | 1.3451 |
| 1 | Daily SMA50 | 1.3460 |
| 2 | Daily SMA100 | 1.3508 |
| 3 | Daily SMA200 | 1.3272 |
The previous day high was 1.3646 while the previous day low was 1.3561. The daily 38.2% Fib levels comes at 1.3614, expected to provide support. Similarly, the daily 61.8% fib level is at 1.3593, expected to provide support.
Note the levels of interest below:
- Pivot support is noted at 1.3589, 1.3532, 1.3504
- Pivot resistance is noted at 1.3674, 1.3703, 1.376
| Levels | Levels.1 |
|---|---|
| Previous Daily High | 1.3646 |
| Previous Daily Low | 1.3561 |
| Previous Weekly High | 1.3666 |
| Previous Weekly Low | 1.3441 |
| Previous Monthly High | 1.3666 |
| Previous Monthly Low | 1.3262 |
| Daily Fibonacci 38.2% | 1.3614 |
| Daily Fibonacci 61.8% | 1.3593 |
| Daily Pivot Point S1 | 1.3589 |
| Daily Pivot Point S2 | 1.3532 |
| Daily Pivot Point S3 | 1.3504 |
| Daily Pivot Point R1 | 1.3674 |
| Daily Pivot Point R2 | 1.3703 |
| Daily Pivot Point R3 | 1.3760 |
[/s2If]
Join Our Telegram Group
")


