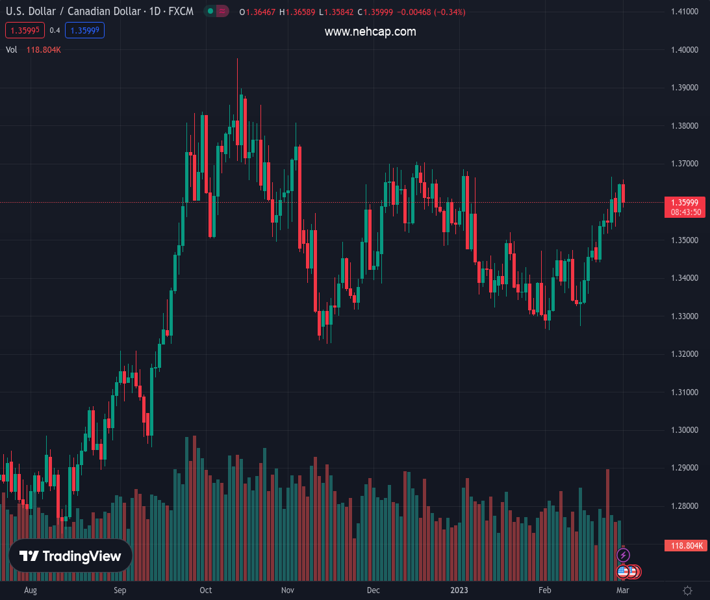
#USDCAD @ 1.35980 comes under intense selling pressure on Wednesday amid broad-based USD weakness. (Pivot Orderbook analysis)
…
This is a premium post.
[s2If !current_user_can(access_s2member_level4)]Please register for PREMIUM VERSION HERE to read full post below containing analysis. In case of any error or you think you are not able to read the full post below, please email us at support#nehcap.com [lwa][/s2If] [s2If current_user_can(access_s2member_level4)]
- USD/CAD comes under intense selling pressure on Wednesday amid broad-based USD weakness.
- The upbeat Chinese PMIs boost investors’ confidence and weigh heavily on the safe-haven buck.
- An intraday downtick in Oil prices could undermine the Loonie and help limit losses for the major.
The pair currently trades last at 1.35980.
The previous day high was 1.3646 while the previous day low was 1.3561. The daily 38.2% Fib levels comes at 1.3614, expected to provide resistance. Similarly, the daily 61.8% fib level is at 1.3593, expected to provide support.
The USD/CAD pair continues losing ground heading into the North American session and reverses a major part of the previous day’s positive to the 1.3660 area. The pair currently trades near the 1.3585 area, or the daily low, and is pressured by the heavily offered tone surrounding the US Dollar.
In fact, the USD Index, which tracks the Greenback against a basket of currencies, retreats sharply from a multi-week high amid a slight recovery in the global risk sentiment. The upbeat Chinese PMI prints released earlier this Wednesday confirmed that recovery in the world’s second-largest economy gained momentum in February. This, in turn, boosts investors’ confidence and weighs on the safe-haven buck.
The downside for the USD, however, is likely to remain limited amid firming expectations that the Fed will continue to raise interest rates for longer to tame inflation. Moreover, the incoming positive US macro data pointed to an economy that remains resilient, which should allow the US central bank to stick to its hawkish stance. This, in turn, favours the USD bulls and could lend support to the USD/CAD pair.
Furthermore, an intraday downtick in Crude Oil prices might undermine the commodity-linked Loonie and supports prospects for the emergence of some dip-buying around the USD/CAD pair. Investors remain worried that rising borrowing costs will dampen economic growth and dent fuel demand. This, along with signs of increasing US crude stockpiles and additional supply from OPEC – act as a headwind for the black liquid.
The aforementioned fundamental backdrop warrants some caution before placing aggressive bearish bets around the USD/CAD pair and positioning for any further depreciating move. Next on tap is the release of the US ISM Manufacturing PMI, which, along with the broader risk sentiment, will drive the USD demand and provide some impetus. Traders will also take cues from Oil price dynamics to grab short-term opportunities.
Technical Levels: Supports and Resistances
USDCAD currently trading at 1.3585 at the time of writing. Pair opened at 1.3646 and is trading with a change of -0.45 % .
| Overview | Overview.1 | |
|---|---|---|
| 0 | Today last price | 1.3585 |
| 1 | Today Daily Change | -0.0061 |
| 2 | Today Daily Change % | -0.4500 |
| 3 | Today daily open | 1.3646 |
The pair remains strongly bullish on the daily timeframe. It trades above its 20 SMA @ 1.3451, 50 SMA 1.346, 100 SMA @ 1.3508 and 200 SMA @ 1.3272.
| Trends | Trends.1 | |
|---|---|---|
| 0 | Daily SMA20 | 1.3451 |
| 1 | Daily SMA50 | 1.3460 |
| 2 | Daily SMA100 | 1.3508 |
| 3 | Daily SMA200 | 1.3272 |
The previous day high was 1.3646 while the previous day low was 1.3561. The daily 38.2% Fib levels comes at 1.3614, expected to provide resistance. Similarly, the daily 61.8% fib level is at 1.3593, expected to provide support.
Note the levels of interest below:
- Pivot support is noted at 1.3589, 1.3532, 1.3504
- Pivot resistance is noted at 1.3674, 1.3703, 1.376
| Levels | Levels.1 |
|---|---|
| Previous Daily High | 1.3646 |
| Previous Daily Low | 1.3561 |
| Previous Weekly High | 1.3666 |
| Previous Weekly Low | 1.3441 |
| Previous Monthly High | 1.3666 |
| Previous Monthly Low | 1.3262 |
| Daily Fibonacci 38.2% | 1.3614 |
| Daily Fibonacci 61.8% | 1.3593 |
| Daily Pivot Point S1 | 1.3589 |
| Daily Pivot Point S2 | 1.3532 |
| Daily Pivot Point S3 | 1.3504 |
| Daily Pivot Point R1 | 1.3674 |
| Daily Pivot Point R2 | 1.3703 |
| Daily Pivot Point R3 | 1.3760 |
[/s2If]
Join Our Telegram Group
")


