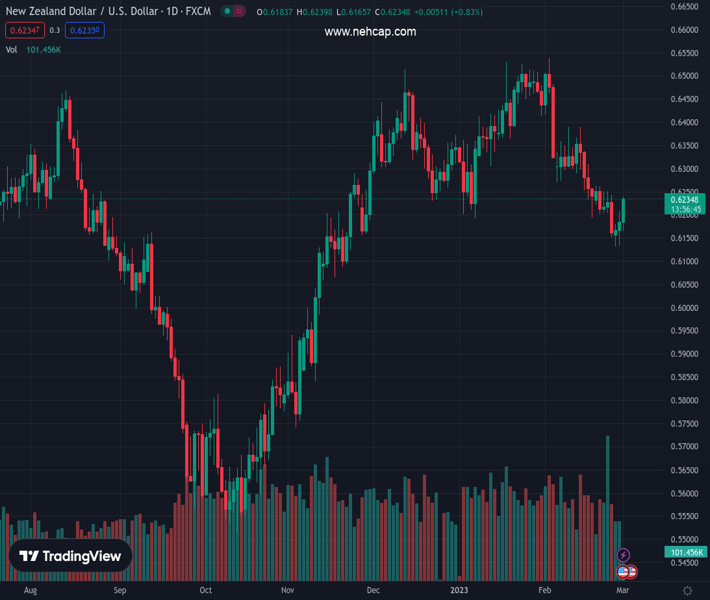
#NZDUSD @ 0.62378 gains strong positive traction and builds on the overnight bounce from the YTD low. (Pivot Orderbook analysis)
…
This is a premium post.
[s2If !current_user_can(access_s2member_level4)]Please register for PREMIUM VERSION HERE to read full post below containing analysis. In case of any error or you think you are not able to read the full post below, please email us at support#nehcap.com [lwa][/s2If] [s2If current_user_can(access_s2member_level4)]
- NZD/USD gains strong positive traction and builds on the overnight bounce from the YTD low.
- The upbeat Chinese PMIs, a positive risk tone provide a goodish lift to the risk-sensitive Kiwi.
- Recession fears, hawkish Fed expectations act as a tailwind for the USD and could cap gains.
The pair currently trades last at 0.62378.
The previous day high was 0.6208 while the previous day low was 0.6133. The daily 38.2% Fib levels comes at 0.6179, expected to provide support. Similarly, the daily 61.8% fib level is at 0.6162, expected to provide support.
The NZD/USD pair catches aggressive bids on Wednesday and builds on the previous day’s goodish rebound from the 0.6130 area, or its lowest level since November 23. The strong intraday positive move remains uninterrupted through the early European session and lifts spot prices to a fresh weekly high, back closer to the 0.6240-0.6250 supply zone.
The upbeat Chinese data, which showed that business activity in the country rose to pre-COVID levels, turns out to be a key factor boosting demand for antipodean currencies, including the Kiwi. In fact, China’s official Manufacturing PMI rose to 52.6 in February – the highest since April 2012. Moreover, the gauge for the non-manufacturing sector climbed to 56.3 in February, or the highest level since June 2022.
This indicates that recovery in the world’s second-largest economy is gaining steam and leads to a modest recovery in the global risk sentiment. This, in turn, undermines the safe-haven US Dollar and benefits the risk-sensitive Kiwi. That said, looming recession risks should keep a lid on the optimism, which, along with hawkish Fed expectations could act as a tailwind for the Greenback and cap the NZD/USD pair.
The markets now seem convinced that the US central bank will have to raise interest rates for longer to tame stubbornly high inflation. This remains supportive of elevated US Treasury bond yields and favours the USD bulls. Hence, it will be prudent to wait for strong follow-through buying before confirming that the NZD/USD pair has formed a bottom around the 0.6135-0.6130 area and placing fresh bullish bets.
Traders now look forward to the US economic docket, featuring the release of ISM Manufacturing PMI later during the early North American session. This, along with the US bond yields and the broader risk sentiment, will influence the USD price dynamics and produce short-term trading opportunities around the NZD/USD pair.
Technical Levels: Supports and Resistances
NZDUSD currently trading at 0.6234 at the time of writing. Pair opened at 0.6181 and is trading with a change of 0.86 % .
| Overview | Overview.1 | |
|---|---|---|
| 0 | Today last price | 0.6234 |
| 1 | Today Daily Change | 0.0053 |
| 2 | Today Daily Change % | 0.8600 |
| 3 | Today daily open | 0.6181 |
The pair is trading below its 20 Daily moving average @ 0.6289, below its 50 Daily moving average @ 0.6341 , above its 100 Daily moving average @ 0.6198 and above its 200 Daily moving average @ 0.6182
| Trends | Trends.1 | |
|---|---|---|
| 0 | Daily SMA20 | 0.6289 |
| 1 | Daily SMA50 | 0.6341 |
| 2 | Daily SMA100 | 0.6198 |
| 3 | Daily SMA200 | 0.6182 |
The previous day high was 0.6208 while the previous day low was 0.6133. The daily 38.2% Fib levels comes at 0.6179, expected to provide support. Similarly, the daily 61.8% fib level is at 0.6162, expected to provide support.
Note the levels of interest below:
- Pivot support is noted at 0.614, 0.6099, 0.6065
- Pivot resistance is noted at 0.6215, 0.6249, 0.6291
| Levels | Levels.1 |
|---|---|
| Previous Daily High | 0.6208 |
| Previous Daily Low | 0.6133 |
| Previous Weekly High | 0.6263 |
| Previous Weekly Low | 0.6151 |
| Previous Monthly High | 0.6538 |
| Previous Monthly Low | 0.6131 |
| Daily Fibonacci 38.2% | 0.6179 |
| Daily Fibonacci 61.8% | 0.6162 |
| Daily Pivot Point S1 | 0.6140 |
| Daily Pivot Point S2 | 0.6099 |
| Daily Pivot Point S3 | 0.6065 |
| Daily Pivot Point R1 | 0.6215 |
| Daily Pivot Point R2 | 0.6249 |
| Daily Pivot Point R3 | 0.6291 |
[/s2If]
Join Our Telegram Group
")


