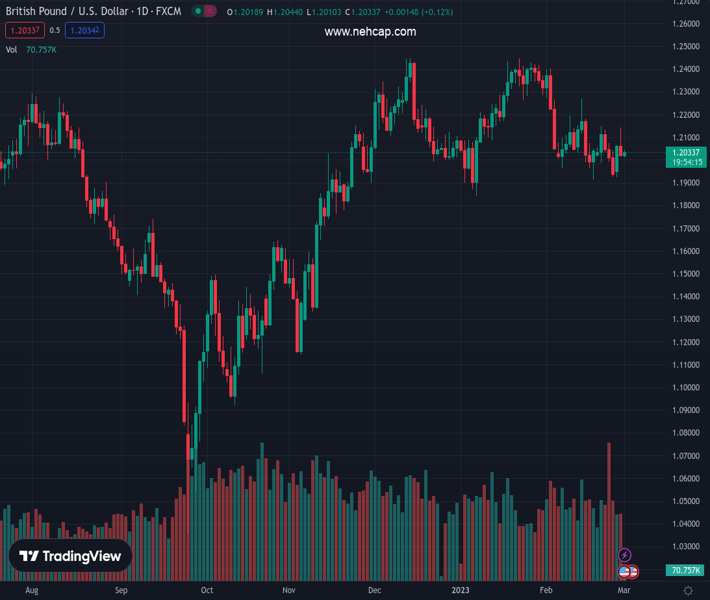
#GBPUSD @ 1.20327 remains pressured after reversing from the short-term key resistance confluence., @nehcap view: Limited downside expected (Pivot Orderbook analysis)
…
This is a premium post.
[s2If !current_user_can(access_s2member_level4)]Please register for PREMIUM VERSION HERE to read full post below containing analysis. In case of any error or you think you are not able to read the full post below, please email us at support#nehcap.com [lwa][/s2If] [s2If current_user_can(access_s2member_level4)]
- GBP/USD remains pressured after reversing from the short-term key resistance confluence.
- Convergence of 200-EMA, one-month-old descending trend line challenges Cable buyers.
- Double bottoms around 1.1920-15 restricts short-term downside of the pair.
The pair currently trades last at 1.20327.
The previous day high was 1.2143 while the previous day low was 1.2027. The daily 38.2% Fib levels comes at 1.2071, expected to provide resistance. Similarly, the daily 61.8% fib level is at 1.2099, expected to provide resistance.
GBP/USD holds lower ground near the intraday bottom surrounding 1.2010, picking up bids of late, as bears keep the reins during early Wednesday. In doing so, the Cable pair justifies the previous day’s pullback from an important resistance, as well as the looming bear cross on the MACD.
While the failure to cross the 1.2110 hurdle, comprising 200-Exponential Moving Average (EMA) and a one-month-old downward-sloping resistance line, keeps the GBP/USD bears hopeful, a clear break of the 1.2100 threshold becomes necessary for the seller’s conviction.
Following that, the “double bottom” bullish formation around 1.1920-15 will be crucial to watch as a downside break of the same won’t hesitate to drag the GBP/USD price towards January’s low near 1.1840.
Alternatively, the pair’s recovery past the 1.2110 resistance confluence needs to cross a one-week-long horizontal resistance near 1.2150 to convince GBP/USD buyers.
In that case, the mid-February swing high of 1.2270 appears the imminent target for the bulls ahead of aiming for the previous monthly top surrounding 1.2400.
It should, however, be noted that the pair’s sustained trading beyond 1.2400 will be difficult as the multiple tops around 1.2445-50 could challenge the bulls afterward.
To sum up, GBP/USD is likely to decline further but the downside room appears limited.
Trend: Limited downside expected
Technical Levels: Supports and Resistances
GBPUSD currently trading at 1.2025 at the time of writing. Pair opened at 1.2027 and is trading with a change of -0.02% % .
| Overview | Overview.1 | |
|---|---|---|
| 0 | Today last price | 1.2025 |
| 1 | Today Daily Change | -0.0002 |
| 2 | Today Daily Change % | -0.02% |
| 3 | Today daily open | 1.2027 |
The pair is trading below its 20 Daily moving average @ 1.2079, below its 50 Daily moving average @ 1.2144 , above its 100 Daily moving average @ 1.1961 and above its 200 Daily moving average @ 1.1925
| Trends | Trends.1 | |
|---|---|---|
| 0 | Daily SMA20 | 1.2079 |
| 1 | Daily SMA50 | 1.2144 |
| 2 | Daily SMA100 | 1.1961 |
| 3 | Daily SMA200 | 1.1925 |
The previous day high was 1.2143 while the previous day low was 1.2027. The daily 38.2% Fib levels comes at 1.2071, expected to provide resistance. Similarly, the daily 61.8% fib level is at 1.2099, expected to provide resistance.
Note the levels of interest below:
- Pivot support is noted at 1.1988, 1.1949, 1.1872
- Pivot resistance is noted at 1.2105, 1.2182, 1.2221
| Levels | Levels.1 |
|---|---|
| Previous Daily High | 1.2143 |
| Previous Daily Low | 1.2027 |
| Previous Weekly High | 1.2148 |
| Previous Weekly Low | 1.1928 |
| Previous Monthly High | 1.2402 |
| Previous Monthly Low | 1.1915 |
| Daily Fibonacci 38.2% | 1.2071 |
| Daily Fibonacci 61.8% | 1.2099 |
| Daily Pivot Point S1 | 1.1988 |
| Daily Pivot Point S2 | 1.1949 |
| Daily Pivot Point S3 | 1.1872 |
| Daily Pivot Point R1 | 1.2105 |
| Daily Pivot Point R2 | 1.2182 |
| Daily Pivot Point R3 | 1.2221 |
[/s2If]
Join Our Telegram Group
")


