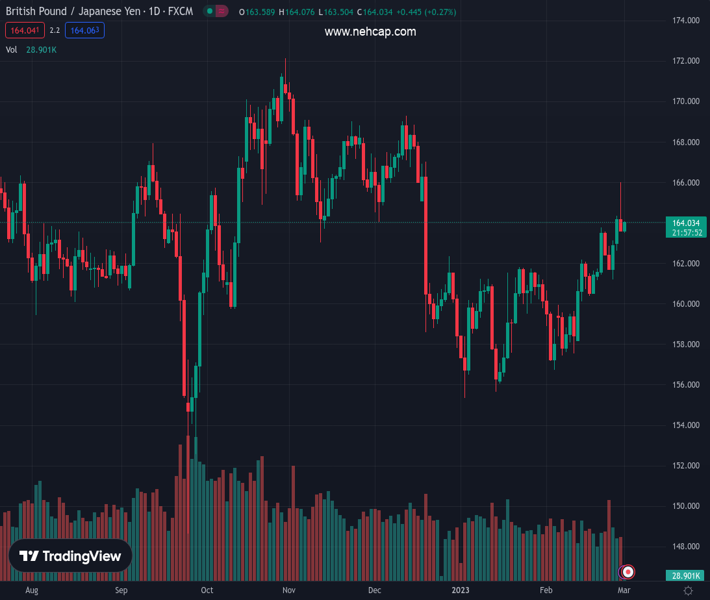
#GBPJPY @ 164.045 formed an inverted hammer, meaning sellers are in charge. (Pivot Orderbook analysis)
…
This is a premium post.
[s2If !current_user_can(access_s2member_level4)]Please register for PREMIUM VERSION HERE to read full post below containing analysis. In case of any error or you think you are not able to read the full post below, please email us at support#nehcap.com [lwa][/s2If] [s2If current_user_can(access_s2member_level4)]
- GBP/JPY formed an inverted hammer, meaning sellers are in charge.
- The GBP/JPY would face strong support at the confluence of the 100/200/20-day EMAs.
- GBP/JPY Price Analysis: In the near term, it’s neutral to upward biased.
The pair currently trades last at 164.045.
The previous day high was 164.31 while the previous day low was 162.61. The daily 38.2% Fib levels comes at 163.66, expected to provide support. Similarly, the daily 61.8% fib level is at 163.26, expected to provide support.
The GBP/JPY registers a minimal upside as Wednesday’s Asian session begins. On Tuesday, the GBP/JPY printed losses of 0.35% and formed an inverted hammer, meaning that further downside is expected. At the time of typing, the GBP/JPY exchanges hands at 163.90 after hitting a YTD high on Tuesday of 166.00.
After hitting a new year-to-date high, the GBP/JPY retraced more than 200 pips and achieved a daily close below 163.60. Traders should be aware that the cross-currency pair pierced a four-month-old downslope trendline, but buyers unable to commit to its longs and sellers stepping in around 166.00 dragged the exchange rates lower.
The Relative Strength Index (RSI), albeit in bullish territory, is almost flat, while the Rate of Change (RoC) suggests that buying pressure is waning. Therefore, further downside is expected.
Hence, the GBP/JPY first support would be the February 28 daily low of 163.58, which, once cleared, would exacerbate a fall toward the weekly low of 162.59. A breach of the latter would send the GBP/JPY toward the confluence of the 100 and the 20-day Exponential Moving Averages (EMAs) at around 161.89/74, respectively.
As an alternate scenario, the GBP/JPY first resistance would be 164.00. Once the GBP/JPY hurdles that level, and the 165.00 figure would be the next to be challenged by Pound Sterling (GBP) buyers, ahead of the YTD high at 166.00.
Technical Levels: Supports and Resistances
GBPJPY currently trading at 163.88 at the time of writing. Pair opened at 164.29 and is trading with a change of -0.25 % .
| Overview | Overview.1 | |
|---|---|---|
| 0 | Today last price | 163.88 |
| 1 | Today Daily Change | -0.41 |
| 2 | Today Daily Change % | -0.25 |
| 3 | Today daily open | 164.29 |
The pair remains strongly bullish on the daily timeframe. It trades above its 20 SMA @ 160.6, 50 SMA 160.05, 100 SMA @ 163.6 and 200 SMA @ 163.36.
| Trends | Trends.1 | |
|---|---|---|
| 0 | Daily SMA20 | 160.60 |
| 1 | Daily SMA50 | 160.05 |
| 2 | Daily SMA100 | 163.60 |
| 3 | Daily SMA200 | 163.36 |
The previous day high was 164.31 while the previous day low was 162.61. The daily 38.2% Fib levels comes at 163.66, expected to provide support. Similarly, the daily 61.8% fib level is at 163.26, expected to provide support.
Note the levels of interest below:
- Pivot support is noted at 163.16, 162.04, 161.46
- Pivot resistance is noted at 164.87, 165.44, 166.57
| Levels | Levels.1 |
|---|---|
| Previous Daily High | 164.31 |
| Previous Daily Low | 162.61 |
| Previous Weekly High | 163.76 |
| Previous Weekly Low | 161.17 |
| Previous Monthly High | 161.85 |
| Previous Monthly Low | 155.36 |
| Daily Fibonacci 38.2% | 163.66 |
| Daily Fibonacci 61.8% | 163.26 |
| Daily Pivot Point S1 | 163.16 |
| Daily Pivot Point S2 | 162.04 |
| Daily Pivot Point S3 | 161.46 |
| Daily Pivot Point R1 | 164.87 |
| Daily Pivot Point R2 | 165.44 |
| Daily Pivot Point R3 | 166.57 |
[/s2If]
Join Our Telegram Group
")


