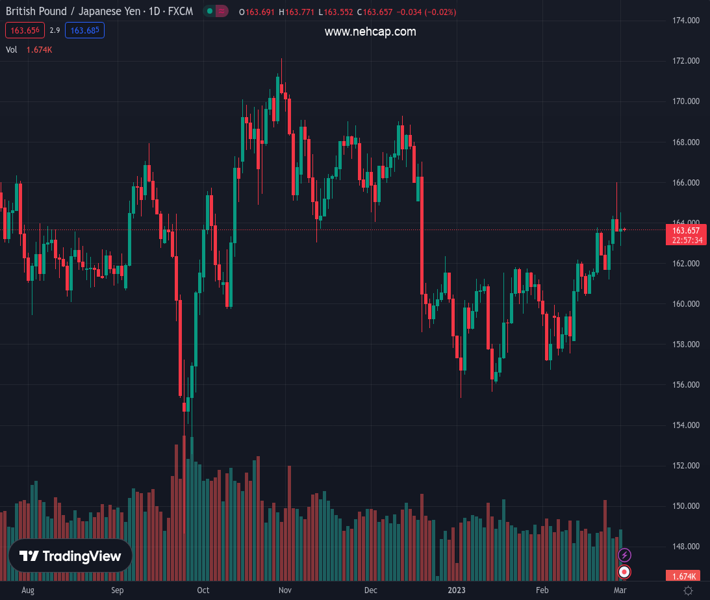
#GBPJPY @ 163.666 After printing an inverted hammer on Tuesday, capped its fall. (Pivot Orderbook analysis)
…
This is a premium post.
[s2If !current_user_can(access_s2member_level4)]Please register for PREMIUM VERSION HERE to read full post below containing analysis. In case of any error or you think you are not able to read the full post below, please email us at support#nehcap.com [lwa][/s2If] [s2If current_user_can(access_s2member_level4)]
- After printing an inverted hammer on Tuesday, GBP/JPY capped its fall.
- The GBP/JPY would face strong support at the confluence of the 100/200/20-day EMAs.
- GBP/JPY Price Analysis: In the near term, it’s neutral to upward biased.
The pair currently trades last at 163.666.
The previous day high was 166.01 while the previous day low was 163.73. The daily 38.2% Fib levels comes at 164.6, expected to provide resistance. Similarly, the daily 61.8% fib level is at 165.14, expected to provide resistance.
The GBP/JPY finished Wednesday’s session printing a doji, meaning that neither buying/selling pressure dominated the session. Nevertheless, Tuesday’s session formed an inverted hammer, usually a bearish biased candlestick, so the GBP/JPY could extend its losses. At the time of writing, the GBP/JPY exchanges hand at 163.62
On Wednesday, the GBP/JPY traded within a 100 pip range throughout the day, though closed nearby the open. For the third time, the GBP/JPY achieved a daily close below a four-month-old downslope trendline, meaning sellers are leaning into that trendline.
The Relative Strength Index (RSI), albeit in bullish territory, is almost flat, while the Rate of Change (RoC) suggests that buying pressure is waning. Therefore, further downside is expected.
Therefore, if the GBP/JPY currency pair breaks below the daily low of 163.58 from February 28th, it would increase the likelihood of a further drop toward the weekly low of 162.59. If the currency pair falls below that level, it could reach the area where the 100 and 20-day Exponential Moving Averages (EMAs) intersect at approximately 161.89/74.
Alternatively, if the GBP/JPY currency pair rises, the first resistance level would be 164.00. If it surpasses that level, GBP buyers may push the pair towards the next level of resistance at 165.00, followed by a challenge of the year-to-date high at 166.00.
Technical Levels: Supports and Resistances
GBPJPY currently trading at 163.82 at the time of writing. Pair opened at 163.74 and is trading with a change of 0.05 % .
| Overview | Overview.1 | |
|---|---|---|
| 0 | Today last price | 163.82 |
| 1 | Today Daily Change | 0.08 |
| 2 | Today Daily Change % | 0.05 |
| 3 | Today daily open | 163.74 |
The pair remains strongly bullish on the daily timeframe. It trades above its 20 SMA @ 160.76, 50 SMA 160.11, 100 SMA @ 163.64 and 200 SMA @ 163.39.
| Trends | Trends.1 | |
|---|---|---|
| 0 | Daily SMA20 | 160.76 |
| 1 | Daily SMA50 | 160.11 |
| 2 | Daily SMA100 | 163.64 |
| 3 | Daily SMA200 | 163.39 |
The previous day high was 166.01 while the previous day low was 163.73. The daily 38.2% Fib levels comes at 164.6, expected to provide resistance. Similarly, the daily 61.8% fib level is at 165.14, expected to provide resistance.
Note the levels of interest below:
- Pivot support is noted at 162.97, 162.21, 160.69
- Pivot resistance is noted at 165.26, 166.78, 167.54
| Levels | Levels.1 |
|---|---|
| Previous Daily High | 166.01 |
| Previous Daily Low | 163.73 |
| Previous Weekly High | 163.76 |
| Previous Weekly Low | 161.17 |
| Previous Monthly High | 166.01 |
| Previous Monthly Low | 156.73 |
| Daily Fibonacci 38.2% | 164.60 |
| Daily Fibonacci 61.8% | 165.14 |
| Daily Pivot Point S1 | 162.97 |
| Daily Pivot Point S2 | 162.21 |
| Daily Pivot Point S3 | 160.69 |
| Daily Pivot Point R1 | 165.26 |
| Daily Pivot Point R2 | 166.78 |
| Daily Pivot Point R3 | 167.54 |
[/s2If]
Join Our Telegram Group
")


