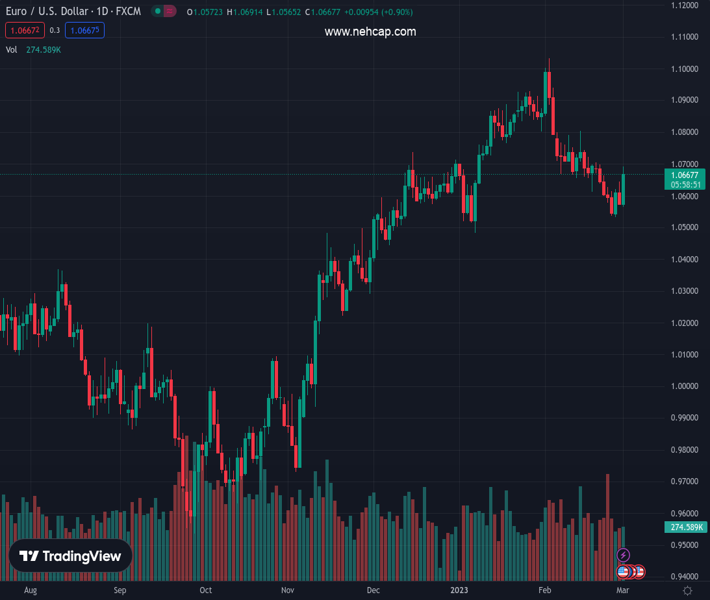
#EURUSD @ 1.06721 US Dollar rises across the board after the ISM report. (Pivot Orderbook analysis)
…
This is a premium post.
[s2If !current_user_can(access_s2member_level4)]Please register for PREMIUM VERSION HERE to read full post below containing analysis. In case of any error or you think you are not able to read the full post below, please email us at support#nehcap.com [lwa][/s2If] [s2If current_user_can(access_s2member_level4)]
- US Dollar rises across the board after the ISM report.
- Inflation indicators of the ISM Manufacturing rise significantly.
- EUR/USD trims gains, holds above critical short-term support levels.
The pair currently trades last at 1.06721.
The previous day high was 1.0646 while the previous day low was 1.0577. The daily 38.2% Fib levels comes at 1.0603, expected to provide support. Similarly, the daily 61.8% fib level is at 1.0619, expected to provide support.
The EUR/USD retreated after the release of the ISM Manufacturing PMI that boosted, at least momentarily, the US Dollar across the board. The pair pulled back from 1.0691, the highest level in a week to 1.0640.
After finding support at the 1.0640 area, the EUR/USD is moving back toward the daily highs as Dollar’s momentum after data fades. The pair is hovering around 1.0670, slightly below the 20-day Simple Moving Average. Despite the retreat the short-term bias continues to point to the upside.
Data released in the US showed activity in the Manufacturing sector contracted again in February with the ISM PMI rising from 47.4 to 47.7 (below 50 marks contraction), against market consensus of 48. The Price Paid Index rose from 44.5 to 51.3, surpassing expectations of a 45 reading.
The inflation indicators of the ISM report pushed Treasury yields to the upside. The US 10-year bond yield reached 4% for the first time since November. The US Dollar reacted to the upside but lost impulse during the last minutes, as stocks and commodity prices rebounded.
The Euro is among the top performers on Wednesday following German inflation data that came in above expectations. The figures add pressure to the European Central Bank. A 50 basis point rate hike seems warranted in March and the focus is on the meetings ahead.
Technical Levels: Supports and Resistances
EURUSD currently trading at 1.0651 at the time of writing. Pair opened at 1.0577 and is trading with a change of 0.7 % .
| Overview | Overview.1 | |
|---|---|---|
| 0 | Today last price | 1.0651 |
| 1 | Today Daily Change | 0.0074 |
| 2 | Today Daily Change % | 0.7000 |
| 3 | Today daily open | 1.0577 |
The pair is trading below its 20 Daily moving average @ 1.0703, below its 50 Daily moving average @ 1.0725 , above its 100 Daily moving average @ 1.0469 and above its 200 Daily moving average @ 1.033
| Trends | Trends.1 | |
|---|---|---|
| 0 | Daily SMA20 | 1.0703 |
| 1 | Daily SMA50 | 1.0725 |
| 2 | Daily SMA100 | 1.0469 |
| 3 | Daily SMA200 | 1.0330 |
The previous day high was 1.0646 while the previous day low was 1.0577. The daily 38.2% Fib levels comes at 1.0603, expected to provide support. Similarly, the daily 61.8% fib level is at 1.0619, expected to provide support.
Note the levels of interest below:
- Pivot support is noted at 1.0554, 1.0531, 1.0485
- Pivot resistance is noted at 1.0623, 1.0668, 1.0691
| Levels | Levels.1 |
|---|---|
| Previous Daily High | 1.0646 |
| Previous Daily Low | 1.0577 |
| Previous Weekly High | 1.0705 |
| Previous Weekly Low | 1.0536 |
| Previous Monthly High | 1.1033 |
| Previous Monthly Low | 1.0533 |
| Daily Fibonacci 38.2% | 1.0603 |
| Daily Fibonacci 61.8% | 1.0619 |
| Daily Pivot Point S1 | 1.0554 |
| Daily Pivot Point S2 | 1.0531 |
| Daily Pivot Point S3 | 1.0485 |
| Daily Pivot Point R1 | 1.0623 |
| Daily Pivot Point R2 | 1.0668 |
| Daily Pivot Point R3 | 1.0691 |
[/s2If]
Join Our Telegram Group
")


