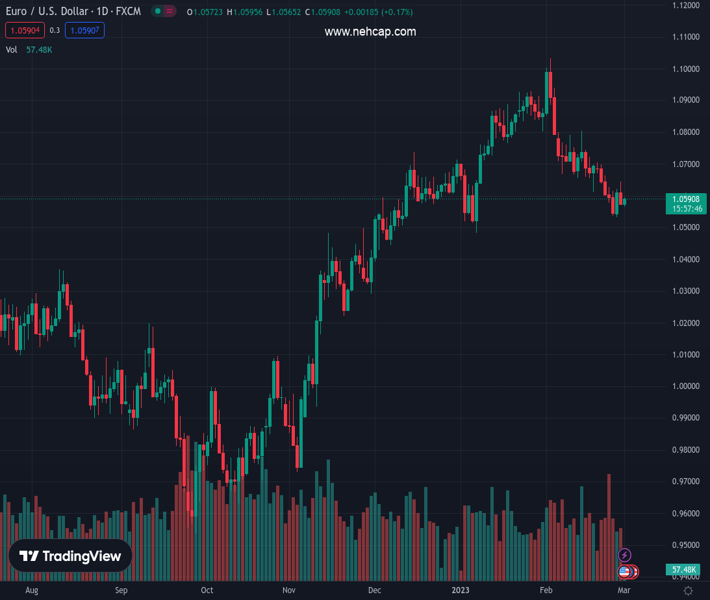
#EURUSD @ 1.05915 begins March month on a positive footing after the biggest monthly fall since September 2022. (Pivot Orderbook analysis)
…
This is a premium post.
[s2If !current_user_can(access_s2member_level4)]Please register for PREMIUM VERSION HERE to read full post below containing analysis. In case of any error or you think you are not able to read the full post below, please email us at support#nehcap.com [lwa][/s2If] [s2If current_user_can(access_s2member_level4)]
- EUR/USD begins March month on a positive footing after the biggest monthly fall since September 2022.
- Cautious optimism in the market allows US Dollar to wobble near multi-day higher.
- Strong inflation data from Spain, France contrasts with downbeat US statistics to also underpin recovery moves.
- Germany’s HICP, US PMIs will be crucial for intraday directions.
The pair currently trades last at 1.05915.
The previous day high was 1.0646 while the previous day low was 1.0577. The daily 38.2% Fib levels comes at 1.0603, expected to provide resistance. Similarly, the daily 61.8% fib level is at 1.0619, expected to provide resistance.
EUR/USD picks up bids to refresh intraday high near 1.0595 heading into Wednesday’s European session. That said, the major currency pair marked the biggest monthly loss since the last September before marking the latest corrective bounce.
In doing so, the Euro pair takes clues from the broad US Dollar pullback amid a month-start sluggish session and pre-data anxiety. It’s worth noting that the upbeat prints of inflation numbers from Spain and France join China-inspired favor to the risk-on mood to also underpin the EUR/USD rebound.
That said, the preliminary readings of Spanish and French Consumer Price Index (CPI) details for February marked upbeat outcomes and bolstered the hawkish concerns surrounding the European Central Bank’s (ECB) next move on Tuesday.
On the contrary, the US Conference Board’s (CB) Consumer Confidence dropped for the second consecutive month to 102.9 versus 106.0 prior (revised) while US Housing Price Index drops 0.1% in December versus -0.6% market forecasts and -0.1% prior. Furthermore, Chicago Purchasing Managers’ Index for February eased to 43.6 from 44.3 previous readings and 45.0 market consensus whereas the Richmond Fed Manufacturing Index for the said month eased below 11.0 prior and -5.0 expected to -16.
It should be noted that strong prints of China’s Caixin and NBS Manufacturing PMIs for February joins the Non-Manufacturing PMI for the said month to mark an upbeat economic rebound in the world’s biggest industrial player and favored the risk profile. Even so, China Finance Minister Liu He said after the data release that the foundation of China’s economic recovery is still not stable.
Against this backdrop, S&P 500 Futures turn positive after initially tracking Wall Street’s mild losses.
However, the firmer US Treasury bond yields and hawkish Fed bets, as well as the global inflation woes, keep the US Dollar on the bull’s radar. That said, the US Dollar Index (DXY) clings to mild losses near 104.85 after February’s impressive north-run.
Looking ahead, the first readings of Germany’s key inflation gauge for February, namely the Harmonized Index of Consumer Prices (HICP), could challenge the pair’s upside momentum on missing the upbeat 0.7% MoM forecasts, versus 0.5% prior. Also important to watch are the S&P Global and ISM PMI details for February.
The EUR/USD pair’s multiple failures to cross the 50-bar Exponential Moving Average (EMA), around 1.0620, join the receding bullish bias of the MACD signals to favor sellers. On the flip side, a two-month-old ascending support line, near 1.0545, could restrict the short-term downside of the pair.
Technical Levels: Supports and Resistances
EURUSD currently trading at 1.0595 at the time of writing. Pair opened at 1.0577 and is trading with a change of 0.17% % .
| Overview | Overview.1 | |
|---|---|---|
| 0 | Today last price | 1.0595 |
| 1 | Today Daily Change | 0.0018 |
| 2 | Today Daily Change % | 0.17% |
| 3 | Today daily open | 1.0577 |
The pair is trading below its 20 Daily moving average @ 1.0703, below its 50 Daily moving average @ 1.0725 , above its 100 Daily moving average @ 1.0469 and above its 200 Daily moving average @ 1.033
| Trends | Trends.1 | |
|---|---|---|
| 0 | Daily SMA20 | 1.0703 |
| 1 | Daily SMA50 | 1.0725 |
| 2 | Daily SMA100 | 1.0469 |
| 3 | Daily SMA200 | 1.0330 |
The previous day high was 1.0646 while the previous day low was 1.0577. The daily 38.2% Fib levels comes at 1.0603, expected to provide resistance. Similarly, the daily 61.8% fib level is at 1.0619, expected to provide resistance.
Note the levels of interest below:
- Pivot support is noted at 1.0554, 1.0531, 1.0485
- Pivot resistance is noted at 1.0623, 1.0668, 1.0691
| Levels | Levels.1 |
|---|---|
| Previous Daily High | 1.0646 |
| Previous Daily Low | 1.0577 |
| Previous Weekly High | 1.0705 |
| Previous Weekly Low | 1.0536 |
| Previous Monthly High | 1.1033 |
| Previous Monthly Low | 1.0533 |
| Daily Fibonacci 38.2% | 1.0603 |
| Daily Fibonacci 61.8% | 1.0619 |
| Daily Pivot Point S1 | 1.0554 |
| Daily Pivot Point S2 | 1.0531 |
| Daily Pivot Point S3 | 1.0485 |
| Daily Pivot Point R1 | 1.0623 |
| Daily Pivot Point R2 | 1.0668 |
| Daily Pivot Point R3 | 1.0691 |
[/s2If]
Join Our Telegram Group
")


