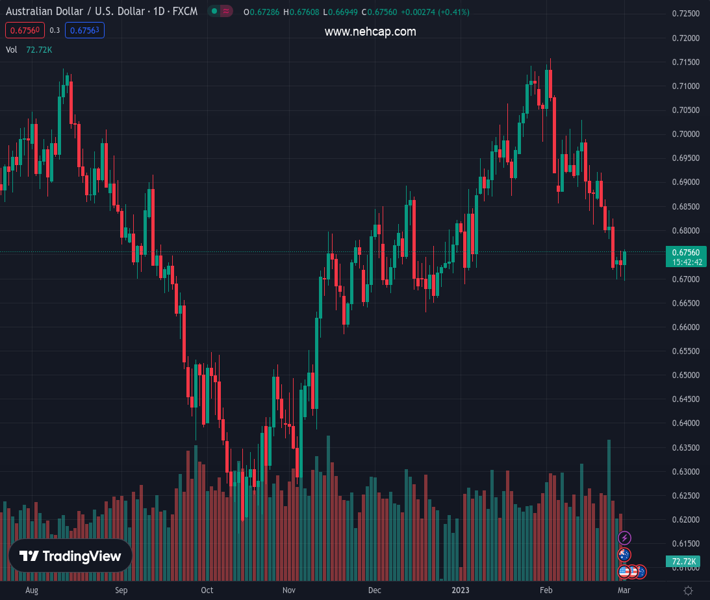
#AUDUSD @ 0.67545 is struggling to extend recovery above 0.6760, upside looks favored amid the risk-on impulse. (Pivot Orderbook analysis)
…
This is a premium post.
[s2If !current_user_can(access_s2member_level4)]Please register for PREMIUM VERSION HERE to read full post below containing analysis. In case of any error or you think you are not able to read the full post below, please email us at support#nehcap.com [lwa][/s2If] [s2If current_user_can(access_s2member_level4)]
- AUD/USD is struggling to extend recovery above 0.6760, upside looks favored amid the risk-on impulse.
- Federal Reserve might turn more hawkish if US ISM Manufacturing PMI delivers a surprise jump.
- A sense of relief has been observed by the Reserve Bank of Australia as inflation has softened significantly.
- AUD/USD looks failing to turn bullish despite a responsive buying move amid an Inverted Flag formation.
The pair currently trades last at 0.67545.
The previous day high was 0.6758 while the previous day low was 0.6704. The daily 38.2% Fib levels comes at 0.6724, expected to provide support. Similarly, the daily 61.8% fib level is at 0.6737, expected to provide support.
AUD/USD has stretched its V-shape recovery move above to near the 0.6760 resistance in the early European session. The Aussie asset witnessed a sell-off in the Asian session after the release of the downbeat Australian Gross Domestic Product (GDP) and a sheer decline in the monthly Consumer Price Index (CPI). The downside bias in the Australian Dollar faded after the release of the upbeat Caixin Manufacturing PMI data, which infused fresh blood into the Aussie and resulted in a V-shape recovery.
S&P500 futures have turned positive after recovering significant losses posted in the Tokyo session, portraying a sheer recovery in the risk appetite theme. The US Dollar Index (DXY) has refreshed its day low below 104.47 as investors have ignored the uncertainty associated with hawkish Federal Reserve (Fed) bets. Also, the safe-haven assets are struggling to find a cushion as investors have underpinned the risk-on mood. Contrary to the positive market sentiment, the return offered on the 10-year US Treasury bonds looks still solid around 3.94%.
Investors dumped the Australian Dollar in the Asian session after the Australian Bureau of Statistics reported significantly lower monthly Consumer Price Index (CPI) figures than anticipation. The monthly Consumer Price Index (CPI) (Jan) dropped significantly to 7.4% from the expectations of 8.0% and the prior release of 8.4%. A mammoth decline in the inflation data is going to provide a big relief to Reserve Bank of Australia (RBA) policymakers.
The Reserve Bank of Australia has been making efforts in bringing down inflationary pressures by the continuation of policy tightening. Reserve Bank of Australia Governor Philip Lowe has already pushed its Official Cash Rate (OCR) to 3.35% in order to tame the stubborn inflation. And, more rates must be in pipeline to achieve price stability sooner.
Apart from the monthly CPI, Australian Gross Domestic Product (GDP) (Q4) has dropped to 0.5% from the consensus of 0.8% and Q3 figure of 0.6%. On an annualized basis, the GDP has remained in line with expectations at 2.7%. A decline in GDP numbers also showcases lower demand from households, which will trim inflation projections ahead as producers will be forced to scale down the prices of their offerings.
It was widely anticipated that China’s manufacturing sector will outperform after the rollback of strict lockdown measures. Chinese administration and the People’s Bank of China (PBoC) are dedicated to spurring economic recovery by improving domestic demand. The IHS Markit reported the Caixin Manufacturing PMI data at 51.6, higher than the expectations of 50.2 and the former release of 49.2.
Apart from that, China’s National Bureau of Statistics (NBS) Manufacturing PMI (Feb) landed higher at 52.6 vs. the consensus of 50.5 and the prior release of 50.1. The Services Manufacturing PMI exploded to 56.3 against 54.4 released in January while the street was anticipating a downbeat figure at 49.7.
It is worth noting that Australia is the leading trading partner of China and a sharp recovery in the Chinese economy is also supportive of the Australian Dollar.
The street is awaiting the release of the United States Institute of Supply Management (ISM) Manufacturing PMI data. As per the consensus, the economic data is seen at 48.0 from the former release of 47.4. Apart from that, the New Orders Index that conveys forward demand is expected to rebound to 43.7 from the prior figure of 42.5.
It is worth noting that the Manufacturing PMI is in a contraction phase consecutively for the past three months. A figure below 50.0 is considered as a contraction in the extent of activities. Federal Reserve policymakers are expected to keenly watch the PMI figures as a surprise upside could strengthen the expectations of more hikes ahead.
Despite a responsive buying action near the round-level support of 0.6700, the outlook for AUD/USD looks gloomy as the asset is forming an Inverted Flag chart pattern. The chart pattern indicates a sheer consolidation that is followed by a breakdown. Usually, the consolidation phase of the chart pattern serves as an inventory adjustment in which those participants initiate shorts, which prefer to enter an auction after the establishment of a bearish bias.
The 100-period Exponential Moving Average (EMA) around 0.6760 is acting as a barricade for the Aussie bulls.
Also, the Relative Strength Index (RSI) (14) is oscillating in the 40.00-60.00 range, indicating a consolidation ahead.
Technical Levels: Supports and Resistances
AUDUSD currently trading at 0.6748 at the time of writing. Pair opened at 0.6726 and is trading with a change of 0.33 % .
| Overview | Overview.1 | |
|---|---|---|
| 0 | Today last price | 0.6748 |
| 1 | Today Daily Change | 0.0022 |
| 2 | Today Daily Change % | 0.3300 |
| 3 | Today daily open | 0.6726 |
The pair is trading below its 20 Daily moving average @ 0.6898, below its 50 Daily moving average @ 0.6895 , above its 100 Daily moving average @ 0.6735 and below its 200 Daily moving average @ 0.6797
| Trends | Trends.1 | |
|---|---|---|
| 0 | Daily SMA20 | 0.6898 |
| 1 | Daily SMA50 | 0.6895 |
| 2 | Daily SMA100 | 0.6735 |
| 3 | Daily SMA200 | 0.6797 |
The previous day high was 0.6758 while the previous day low was 0.6704. The daily 38.2% Fib levels comes at 0.6724, expected to provide support. Similarly, the daily 61.8% fib level is at 0.6737, expected to provide support.
Note the levels of interest below:
- Pivot support is noted at 0.6701, 0.6676, 0.6647
- Pivot resistance is noted at 0.6754, 0.6783, 0.6808
| Levels | Levels.1 |
|---|---|
| Previous Daily High | 0.6758 |
| Previous Daily Low | 0.6704 |
| Previous Weekly High | 0.6921 |
| Previous Weekly Low | 0.6719 |
| Previous Monthly High | 0.7158 |
| Previous Monthly Low | 0.6698 |
| Daily Fibonacci 38.2% | 0.6724 |
| Daily Fibonacci 61.8% | 0.6737 |
| Daily Pivot Point S1 | 0.6701 |
| Daily Pivot Point S2 | 0.6676 |
| Daily Pivot Point S3 | 0.6647 |
| Daily Pivot Point R1 | 0.6754 |
| Daily Pivot Point R2 | 0.6783 |
| Daily Pivot Point R3 | 0.6808 |
[/s2If]
Join Our Telegram Group
")


