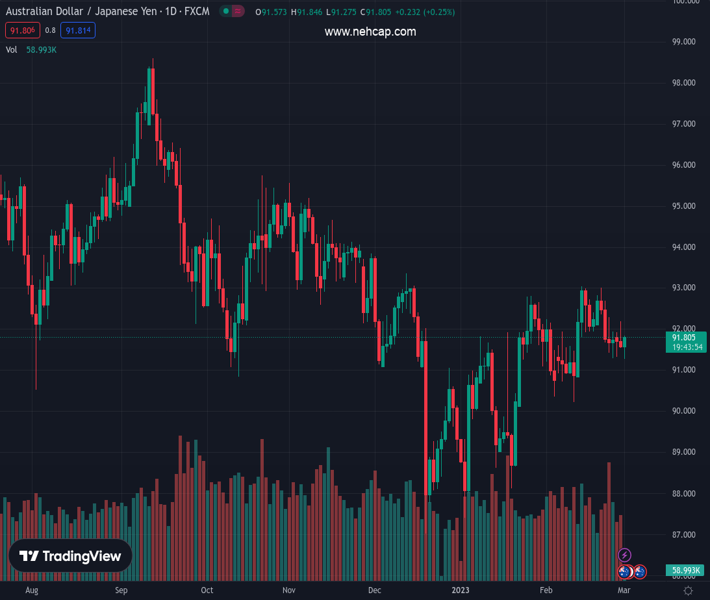
#AUDJPY @ 91.8140 recovers from two-week low after strong China activity data for February., @nehcap view: Limited recovery expected (Pivot Orderbook analysis)
…
This is a premium post.
[s2If !current_user_can(access_s2member_level4)]Please register for PREMIUM VERSION HERE to read full post below containing analysis. In case of any error or you think you are not able to read the full post below, please email us at support#nehcap.com [lwa][/s2If] [s2If current_user_can(access_s2member_level4)]
- AUD/JPY recovers from two-week low after strong China activity data for February.
- Previous support line from January 19 joins bearish MACD signals, steady RSI (14) to challenge bulls.
- Fresh selling needs a clear break of 91.30 to aim for 50-DMA.
The pair currently trades last at 91.8140.
The previous day high was 92.2 while the previous day low was 91.56. The daily 38.2% Fib levels comes at 91.8, expected to provide support. Similarly, the daily 61.8% fib level is at 91.95, expected to provide resistance.
AUD/JPY picks up bids to refresh intraday high around 91.80, reversing the initial fall to the fortnight’s low, as strong data from Australia’s key customer favor pair buyers during early Wednesday.
China’s Caixin Manufacturing PMI rose to 51.6 versus 50.2 expected and 49.2 for February. In doing so, the private manufacturing activity gauge traced the official numbers. Earlier in the day, China NBS Manufacturing PMI jumped to 52.6 compared to 50.5 market forecasts and 50.1 prior. More importantly, Non-Manufacturing PMI rallied to 56.3 versus analysts’ expectations of 49.7 and 54.4 previous readings.
With this, the cross-currency pair rises towards the support-turned-resistance line stretched from January 19, close to 92.00 by the press time.
The pair’s data-led bounce, however, lacks support from the MACD and RSI (14), as well as the GDP and inflation numbers from Australia. As a result, the AUD/JPY recovery remains doubtful.
Even if the AUD/JPY pair crosses the 92.00 hurdle, the 200-DMA level surrounding 93.15 appears a tough nut to crack for the bulls.
Alternatively, an immediate horizontal area near 91.30 precedes the 91.00 round figure and the 50-DMA support of near 90.95 to restrict the short-term AUD/JPY downside.
Following that, February’s low of 90.23 and the 90.00 psychological magnet will be in focus.
Trend: Limited recovery expected
Technical Levels: Supports and Resistances
AUDJPY currently trading at 91.78 at the time of writing. Pair opened at 91.56 and is trading with a change of 0.24% % .
| Overview | Overview.1 | |
|---|---|---|
| 0 | Today last price | 91.78 |
| 1 | Today Daily Change | 0.22 |
| 2 | Today Daily Change % | 0.24% |
| 3 | Today daily open | 91.56 |
The pair is trading below its 20 Daily moving average @ 91.79, above its 50 Daily moving average @ 90.9 , below its 100 Daily moving average @ 92.11 and below its 200 Daily moving average @ 93.13
| Trends | Trends.1 | |
|---|---|---|
| 0 | Daily SMA20 | 91.79 |
| 1 | Daily SMA50 | 90.90 |
| 2 | Daily SMA100 | 92.11 |
| 3 | Daily SMA200 | 93.13 |
The previous day high was 92.2 while the previous day low was 91.56. The daily 38.2% Fib levels comes at 91.8, expected to provide support. Similarly, the daily 61.8% fib level is at 91.95, expected to provide resistance.
Note the levels of interest below:
- Pivot support is noted at 91.35, 91.14, 90.72
- Pivot resistance is noted at 91.99, 92.41, 92.62
| Levels | Levels.1 |
|---|---|
| Previous Daily High | 92.20 |
| Previous Daily Low | 91.56 |
| Previous Weekly High | 93.01 |
| Previous Weekly Low | 91.31 |
| Previous Monthly High | 93.06 |
| Previous Monthly Low | 90.24 |
| Daily Fibonacci 38.2% | 91.80 |
| Daily Fibonacci 61.8% | 91.95 |
| Daily Pivot Point S1 | 91.35 |
| Daily Pivot Point S2 | 91.14 |
| Daily Pivot Point S3 | 90.72 |
| Daily Pivot Point R1 | 91.99 |
| Daily Pivot Point R2 | 92.41 |
| Daily Pivot Point R3 | 92.62 |
[/s2If]
Join Our Telegram Group
")


