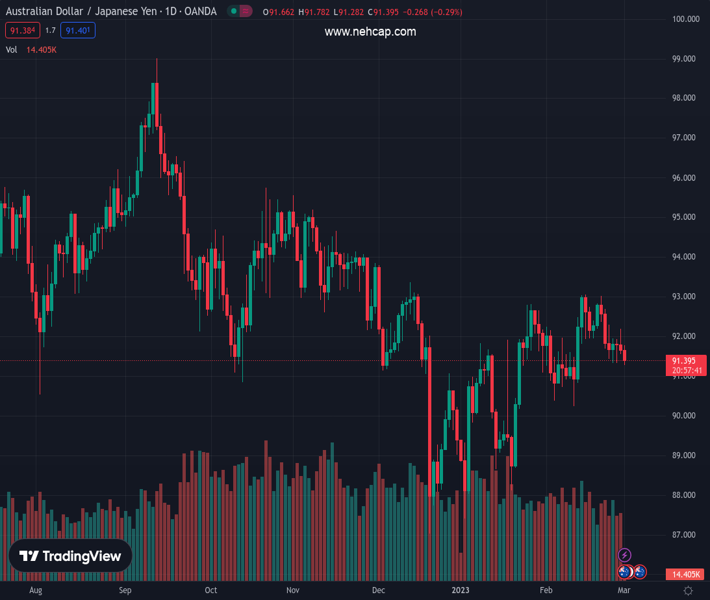
#AUDJPY @ 91.3460 takes offers to add to previous pullback from one-week high after upbeat Aussie GDP. (Pivot Orderbook analysis)
…
This is a premium post.
[s2If !current_user_can(access_s2member_level4)]Please register for PREMIUM VERSION HERE to read full post below containing analysis. In case of any error or you think you are not able to read the full post below, please email us at support#nehcap.com [lwa][/s2If] [s2If current_user_can(access_s2member_level4)]
- AUD/JPY takes offers to add to previous pullback from one-week high after upbeat Aussie GDP.
- Australia Q4 GDP eased to 0.5% QoQ versus 0.8% expected and 0.6% prior, monthly CPI eases for January.
- Market sentiment remains depressed as yields regain upside momentum after sluggish end to February.
- China PMIs, BoJ talks and risk catalysts eyed for clear directions.
The pair currently trades last at 91.3460.
The previous day high was 92.2 while the previous day low was 91.56. The daily 38.2% Fib levels comes at 91.8, expected to provide resistance. Similarly, the daily 61.8% fib level is at 91.95, expected to provide resistance.
AUD/JPY drops to 91.36 while refreshing the intraday low on lower-than-expected Aussie economic growth during early Wednesday. In doing so, the risk-barometer pair also takes clues from the market’s sour sentiment amid hopes of higher rates and worsening inflation fears. With this, the cross-currency pair also pays little heed to the dovish bias surrounding the Bank of Japan (BoJ), as signalled by the incoming policymakers’ latest speeches.
Australia’s fourth-quarter (Q4) Gross Domestic Product (GDP) figures came in lower than expected 0.8% and 0.6% prior readings while flashing 0.5% quarterly growth. The yearly GDP growth, however, matches 2.7% market consensus, down from 5.9% prior. On the same line is the nation’s monthly Consumer Price Index (CPI) data for January as it dropped to 7.4% versus 8.0% expected and 8.4% prior.
Also read: Breaking: Aussie data dump crashes AUD/USD
Earlier in the day, Australia’s S&P Global Manufacturing PMI for February improved to 50.5 versus 50.1 analysts’ expectations.
Apart from the downbeat Aussie GDP, the market’s sour sentiment also weighed on the AUD/JPY pair. The same contradicts the dovish BoJ talks.
Risk profile remains weak during early Wednesday as the all-important March month begins, which comprises Federal Reserve (Fed) Chairman Jerome Powell’s testimony and the Federal Open Market Committee (FOMC) monetary policy meeting. It should be noted that the escalating fears of more supply crunch and inflation pressure also contribute to the risk-off mood.
While portraying the same, S&P 500 Futures track Wall Street’s mild losses whereas the US 10-year Treasury bond yields regain upside momentum targeting the 4.0% hurdle after witnessing a pullback late Tuesday.
Looking forward, China’s official activity data for February precedes Caixin Manufacturing PMI for the said month to direct intraday AUD/JPY moves. However, major attention should be given to the risk catalyst and the Bank of Japan (BoJ) talks as the incoming board struggles to defend the Japanese central bank’s ultra-easy monetary policy.
A daily closing below the six-week-old ascending support line, now resistance around 92.00, keeps AUD/JPY bears hopeful of probing the previous monthly low surrounding 90.90.
Technical Levels: Supports and Resistances
AUDJPY currently trading at 91.6 at the time of writing. Pair opened at 91.56 and is trading with a change of 0.04% % .
| Overview | Overview.1 | |
|---|---|---|
| 0 | Today last price | 91.6 |
| 1 | Today Daily Change | 0.04 |
| 2 | Today Daily Change % | 0.04% |
| 3 | Today daily open | 91.56 |
The pair is trading below its 20 Daily moving average @ 91.79, above its 50 Daily moving average @ 90.9 , below its 100 Daily moving average @ 92.11 and below its 200 Daily moving average @ 93.13
| Trends | Trends.1 | |
|---|---|---|
| 0 | Daily SMA20 | 91.79 |
| 1 | Daily SMA50 | 90.90 |
| 2 | Daily SMA100 | 92.11 |
| 3 | Daily SMA200 | 93.13 |
The previous day high was 92.2 while the previous day low was 91.56. The daily 38.2% Fib levels comes at 91.8, expected to provide resistance. Similarly, the daily 61.8% fib level is at 91.95, expected to provide resistance.
Note the levels of interest below:
- Pivot support is noted at 91.35, 91.14, 90.72
- Pivot resistance is noted at 91.99, 92.41, 92.62
| Levels | Levels.1 |
|---|---|
| Previous Daily High | 92.20 |
| Previous Daily Low | 91.56 |
| Previous Weekly High | 93.01 |
| Previous Weekly Low | 91.31 |
| Previous Monthly High | 93.06 |
| Previous Monthly Low | 90.24 |
| Daily Fibonacci 38.2% | 91.80 |
| Daily Fibonacci 61.8% | 91.95 |
| Daily Pivot Point S1 | 91.35 |
| Daily Pivot Point S2 | 91.14 |
| Daily Pivot Point S3 | 90.72 |
| Daily Pivot Point R1 | 91.99 |
| Daily Pivot Point R2 | 92.41 |
| Daily Pivot Point R3 | 92.62 |
[/s2If]
Join Our Telegram Group
")


