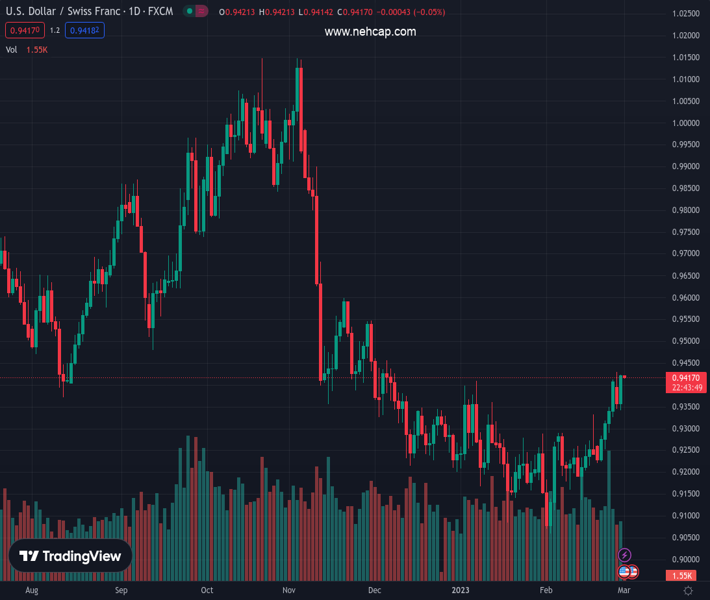
#USDCHF @ 0.94164 is marching towards 0.9430 as investors’ risk appetite has trimmed dramatically. (Pivot Orderbook analysis)
…
This is a premium post.
[s2If !current_user_can(access_s2member_level4)]Please register for PREMIUM VERSION HERE to read full post below containing analysis. In case of any error or you think you are not able to read the full post below, please email us at support#nehcap.com [lwa][/s2If] [s2If current_user_can(access_s2member_level4)]
- USD/CHF is marching towards 0.9430 as investors’ risk appetite has trimmed dramatically.
- The street is expecting that US recession fears cannot be ignored as the Fed has decided to announce more rates.
- Switzerland’s government admitted that it expects an economic slowdown but no recession this year.
The pair currently trades last at 0.94164.
The previous day high was 0.9429 while the previous day low was 0.9344. The daily 38.2% Fib levels comes at 0.9377, expected to provide support. Similarly, the daily 61.8% fib level is at 0.9397, expected to provide support.
The USD/CHF pair is facing fragile hurdles after a sheer run-up of around 0.9420 in the early Tokyo session. The Swiss Franc asset is expected to continue its vertical run as investors are gung-ho for safe-haven assets to dodge sheer volatility.
Federal Reserve (Fed) policymakers have kept on reiterating that the current monetary policy is not sufficiently restrictive enough to bring down the persistent inflation in the near period. Therefore, investors should brace for more rate hikes to cool down the Consumer Price Index (CPI) significantly.
Gains generated by S&P500 on Monday were surrendered in Tuesday’s session as the street is anticipating that recession fears cannot be ignored as the Fed has decided to announce more rates through summer to trim the stubbornness in the United States inflation. The US Dollar Index (DXY) has displayed a responsive buying action and has crossed the critical resistance of 104.60 amid a decline in investors’ risk appetite. Meanwhile, the alpha delivered on the 10-year US Treasury yields has scaled marginally higher to near 3.93%.
Contrary to the hawkish stance supported by the street, Vassili Serebriakov, FX strategist, at UBS said “The disinflation story continues. It took a bit of a pause in January, but it’s not a reversal. We think some of the dollar strength is exaggerated. So we are cautiously fading dollar strength.”
On Wednesday, USD/CHF will remain in action amid the release of the US ISM Manufacturing PMI data. The economic data has been reporting a figure below 50.0 for the past three months and a similar performance is expected today, however, the scale of contraction will be lower. The economic data is seen at 48.0 from the former release of 47.4, posing a gloomy outlook for the US economy ahead.
Meanwhile, the Swiss Franc witnessed pressure after a flat Gross Domestic Product (GDP) (Q4) release on Tuesday. The street was expecting a growth of 0.3%. Switzerland’s government said in a statement on Tuesday that it expects an economic slowdown but no recession this year.
Technical Levels: Supports and Resistances
USDCHF currently trading at 0.9418 at the time of writing. Pair opened at 0.9359 and is trading with a change of 0.63 % .
| Overview | Overview.1 | |
|---|---|---|
| 0 | Today last price | 0.9418 |
| 1 | Today Daily Change | 0.0059 |
| 2 | Today Daily Change % | 0.6300 |
| 3 | Today daily open | 0.9359 |
The pair is trading above its 20 Daily moving average @ 0.9244, above its 50 Daily moving average @ 0.9252 , below its 100 Daily moving average @ 0.9459 and below its 200 Daily moving average @ 0.9571
| Trends | Trends.1 | |
|---|---|---|
| 0 | Daily SMA20 | 0.9244 |
| 1 | Daily SMA50 | 0.9252 |
| 2 | Daily SMA100 | 0.9459 |
| 3 | Daily SMA200 | 0.9571 |
The previous day high was 0.9429 while the previous day low was 0.9344. The daily 38.2% Fib levels comes at 0.9377, expected to provide support. Similarly, the daily 61.8% fib level is at 0.9397, expected to provide support.
Note the levels of interest below:
- Pivot support is noted at 0.9326, 0.9293, 0.9241
- Pivot resistance is noted at 0.9411, 0.9462, 0.9496
| Levels | Levels.1 |
|---|---|
| Previous Daily High | 0.9429 |
| Previous Daily Low | 0.9344 |
| Previous Weekly High | 0.9409 |
| Previous Weekly Low | 0.9221 |
| Previous Monthly High | 0.9410 |
| Previous Monthly Low | 0.9085 |
| Daily Fibonacci 38.2% | 0.9377 |
| Daily Fibonacci 61.8% | 0.9397 |
| Daily Pivot Point S1 | 0.9326 |
| Daily Pivot Point S2 | 0.9293 |
| Daily Pivot Point S3 | 0.9241 |
| Daily Pivot Point R1 | 0.9411 |
| Daily Pivot Point R2 | 0.9462 |
| Daily Pivot Point R3 | 0.9496 |
[/s2If]
Join Our Telegram Group
")


