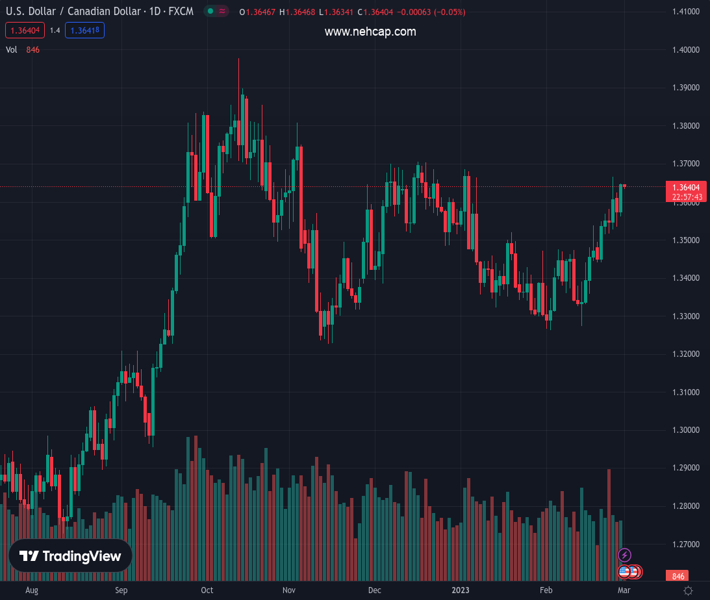
#USDCAD @ 1.36402 is struggling to surpass 1.3650, however, the upside looks favored amid strength in the USD Index. (Pivot Orderbook analysis)
…
This is a premium post.
[s2If !current_user_can(access_s2member_level4)]Please register for PREMIUM VERSION HERE to read full post below containing analysis. In case of any error or you think you are not able to read the full post below, please email us at support#nehcap.com [lwa][/s2If] [s2If current_user_can(access_s2member_level4)]
- USD/CAD is struggling to surpass 1.3650, however, the upside looks favored amid strength in the USD Index.
- The Canadian Dollar witnessed immense heat on Tuesday after releasing weak GDP (Q4) figures.
- The RSI (14) has shifted into the bullish range of 60.00-80.00 after a long period of more than four months.
The pair currently trades last at 1.36402.
The previous day high was 1.3624 while the previous day low was 1.3534. The daily 38.2% Fib levels comes at 1.3569, expected to provide support. Similarly, the daily 61.8% fib level is at 1.359, expected to provide support.
The USD/CAD pair has delivered a minor corrective move after failing to continue its upside momentum above 1.3650 in the early Asian session. The Loonie asset is expected to recover the corrective move as the US Dollar is extremely solid amid rising bets for more rates by the Federal Reserve (Fed) as inflation in the United States economy is getting more stubborn.
The Canadian Dollar witnessed immense heat on Tuesday after releasing weak Gross Domestic Product (GDP) (Q4) numbers. The annualized GDP remained flat lower than the expectations of 1.5% and the former release of 2.3%. While the monthly GDP (Dec) contracted by 0.1% vs. a flat consensus.
The US Dollar Index (DXY) is aiming to cross the immediate resistance of 104.60 as the risk-aversion theme has been strengthened amid hawkish Fed bets and geopolitical tensions. S&P500 was offered on Tuesday as investors see recession amid deepening rate hike discussions among Fed policymakers.
USD/CAD is meaningfully strengthened after delivering a breakout of the downward-sloping trendline plotted from October 13 high at 1.3978 on a daily scale. The 10-period Exponential Moving Average (EMA) at 1.3558 is providing cushion to the US Dollar bulls.
Meanwhile, the Relative Strength Index (RSI) (14) has shifted into the bullish range of 60.00-80.00 after a long period of more than four months. More upside looks favored as the momentum oscillator is not showing any sign of divergence and overbought levels.
The Loonie asset is expected to add more gains after surpassing February 24 high at 1.3665, which will drive the asset toward the horizontal resistance plotted from December 07 high around 1.3700 followed by November 03 high around 1.3800.
Alternatively, a break below February 6 high at 1.3474 will drag the asset to near January 26 high around 1.3408. A slippage below the same will expose the asset to February 16 low around 1.3357.
Technical Levels: Supports and Resistances
USDCAD currently trading at 1.3641 at the time of writing. Pair opened at 1.3576 and is trading with a change of 0.48 % .
| Overview | Overview.1 | |
|---|---|---|
| 0 | Today last price | 1.3641 |
| 1 | Today Daily Change | 0.0065 |
| 2 | Today Daily Change % | 0.4800 |
| 3 | Today daily open | 1.3576 |
The pair remains strongly bullish on the daily timeframe. It trades above its 20 SMA @ 1.3434, 50 SMA 1.346, 100 SMA @ 1.351 and 200 SMA @ 1.3268.
| Trends | Trends.1 | |
|---|---|---|
| 0 | Daily SMA20 | 1.3434 |
| 1 | Daily SMA50 | 1.3460 |
| 2 | Daily SMA100 | 1.3510 |
| 3 | Daily SMA200 | 1.3268 |
The previous day high was 1.3624 while the previous day low was 1.3534. The daily 38.2% Fib levels comes at 1.3569, expected to provide support. Similarly, the daily 61.8% fib level is at 1.359, expected to provide support.
Note the levels of interest below:
- Pivot support is noted at 1.3531, 1.3487, 1.3441
- Pivot resistance is noted at 1.3622, 1.3669, 1.3713
| Levels | Levels.1 |
|---|---|
| Previous Daily High | 1.3624 |
| Previous Daily Low | 1.3534 |
| Previous Weekly High | 1.3666 |
| Previous Weekly Low | 1.3441 |
| Previous Monthly High | 1.3685 |
| Previous Monthly Low | 1.3300 |
| Daily Fibonacci 38.2% | 1.3569 |
| Daily Fibonacci 61.8% | 1.3590 |
| Daily Pivot Point S1 | 1.3531 |
| Daily Pivot Point S2 | 1.3487 |
| Daily Pivot Point S3 | 1.3441 |
| Daily Pivot Point R1 | 1.3622 |
| Daily Pivot Point R2 | 1.3669 |
| Daily Pivot Point R3 | 1.3713 |
[/s2If]
Join Our Telegram Group
")


