Oil price looks exposed to recapture the $76.00 resistance ahead of Caixin Manufacturing PMI data. (Pivot Orderbook analysis)
…
This is a premium post.
[s2If !current_user_can(access_s2member_level4)]Please register for PREMIUM VERSION HERE to read full post below containing analysis. In case of any error or you think you are not able to read the full post below, please email us at support#nehcap.com [lwa][/s2If] [s2If current_user_can(access_s2member_level4)]
- Oil price looks exposed to recapture the $76.00 resistance ahead of Caixin Manufacturing PMI data.
- Caixin Manufacturing PMI is expected to jump to 50.2 from the former release of 49.2.
- BofA sees the terminal rate for the Fed above 6% amid resilience in the demand-drive inflation.
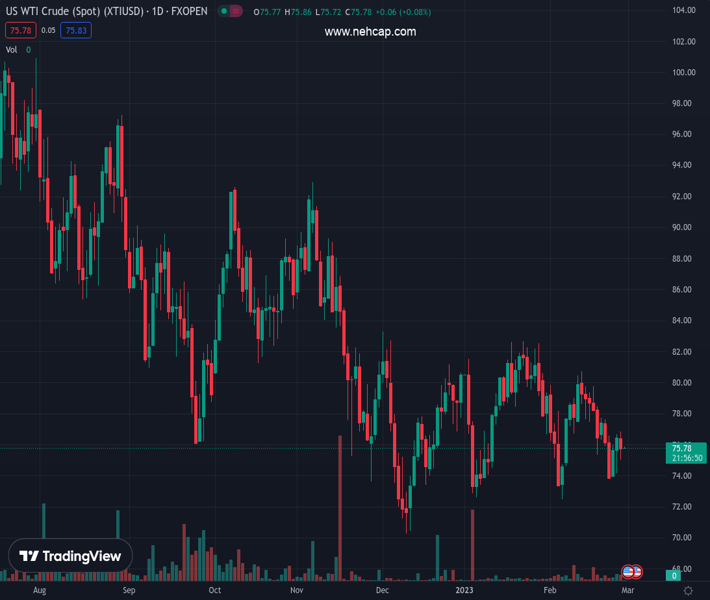
The pair currently trades last at 75.83.
The previous day high was 76.66 while the previous day low was 74.15. The daily 38.2% Fib levels comes at 75.7, expected to provide support. Similarly, the daily 61.8% fib level is at 75.11, expected to provide support.
West Texas Intermediate (WTI), futures on NYMEX, have extended their recovery above the immediate resistance of $75.80 in the early Asian session. The oil price is exposed to the critical resistance of $76.00 as investors are optimistic about the release of the Caixin Manufacturing PMI data, which is scheduled for Wednesday.
Caixin Manufacturing PMI is expected to jump to 50.2 from the former release of 49.2. It is widely anticipated that the Chinese economy will outperform this year after three years of a strict lockdown to contain the spread of Covid-19. Chinese officials are dedicated to spurting overall growth through monetary and fiscal support as reopening measures require sufficient stimulus to infuse optimism in firms and households.
A report released by the People’s Bank of China (PBoC), this week, claimed a rebound in the Chinese economy in 2023 as epidemic prevention has relaxed and consumption has improved. The report also conveys that the vision of the PBoC is not limited to the expansion of domestic demand but is widened to longer-term economic growth and price stability.
Meanwhile, fears of more rates by the Federal Reserve (Fed) as its current monetary policy doesn’t look sufficient enough to bring down inflation, will keep the oil price on the tenterhooks. Analysts at Bank of America (BofA) expect Fed chair Jerome Powell to announce three more rate hikes this year considering the resilience in the demand-driven inflation. The BofA sees the terminal rate above 6% and recession appears more likely than a soft landing.
On Tuesday, the release of the oil inventories data by the United States American Petroleum Institute (API) will keep the oil price in action. Last week, the US agency reported a huge build-up of oil stockpiles by 9.89 million barrels.
Technical Levels: Supports and Resistances
XTIUSD currently trading at 75.83 at the time of writing. Pair opened at 76.64 and is trading with a change of -1.06 % .
| Overview | Overview.1 | |
|---|---|---|
| 0 | Today last price | 75.83 |
| 1 | Today Daily Change | -0.81 |
| 2 | Today Daily Change % | -1.06 |
| 3 | Today daily open | 76.64 |
The pair remains strongly bearish on the daily time frame. It trades below the 20 SMA @ 77.22, 50 SMA 78.02, 100 SMA @ 80.25 and 200 SMA @ 88.6.
| Trends | Trends.1 | |
|---|---|---|
| 0 | Daily SMA20 | 77.22 |
| 1 | Daily SMA50 | 78.02 |
| 2 | Daily SMA100 | 80.25 |
| 3 | Daily SMA200 | 88.60 |
The previous day high was 76.66 while the previous day low was 74.15. The daily 38.2% Fib levels comes at 75.7, expected to provide support. Similarly, the daily 61.8% fib level is at 75.11, expected to provide support.
Note the levels of interest below:
- Pivot support is noted at 74.97, 73.31, 72.47
- Pivot resistance is noted at 77.48, 78.32, 79.98
| Levels | Levels.1 |
|---|---|
| Previous Daily High | 76.66 |
| Previous Daily Low | 74.15 |
| Previous Weekly High | 77.75 |
| Previous Weekly Low | 73.86 |
| Previous Monthly High | 82.68 |
| Previous Monthly Low | 72.64 |
| Daily Fibonacci 38.2% | 75.70 |
| Daily Fibonacci 61.8% | 75.11 |
| Daily Pivot Point S1 | 74.97 |
| Daily Pivot Point S2 | 73.31 |
| Daily Pivot Point S3 | 72.47 |
| Daily Pivot Point R1 | 77.48 |
| Daily Pivot Point R2 | 78.32 |
| Daily Pivot Point R3 | 79.98 |
[/s2If]
Join Our Telegram Group
")


