#NZDUSD @ 0.61620 struggles to defend the week-start bounce off three-month low., @nehcap view: Limited recovery expected (Pivot Orderbook analysis)
…
This is a premium post.
[s2If !current_user_can(access_s2member_level4)]Please register for PREMIUM VERSION HERE to read full post below containing analysis. In case of any error or you think you are not able to read the full post below, please email us at support#nehcap.com [lwa][/s2If] [s2If current_user_can(access_s2member_level4)]
- NZD/USD struggles to defend the week-start bounce off three-month low.
- Bullish candlestick formation, oversold RSI underpin recovery hopes.
- Three-week-old descending resistance line, previous support from November add to the upside filters.
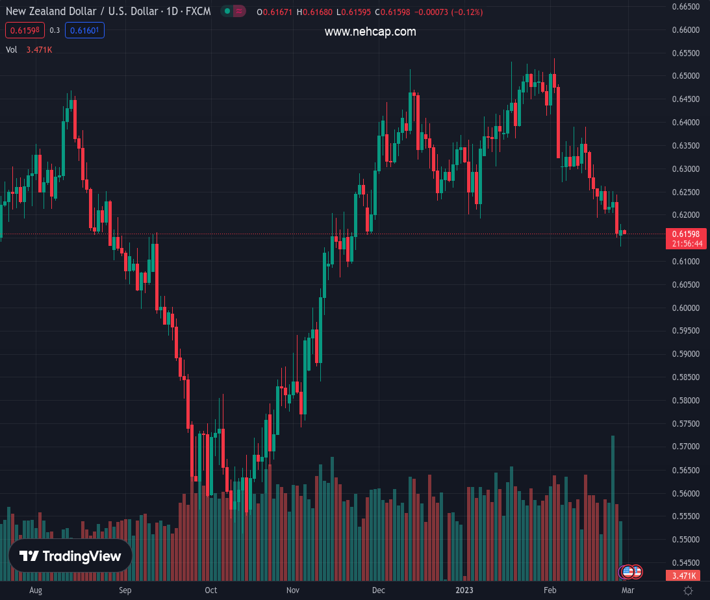
The pair currently trades last at 0.61620.
The previous day high was 0.6252 while the previous day low was 0.6151. The daily 38.2% Fib levels comes at 0.619, expected to provide resistance. Similarly, the daily 61.8% fib level is at 0.6214, expected to provide resistance.
NZD/USD seesaws around 0.6160-65 amid early Tuesday, following a week-start bounce off the lowest level since November.
In doing so, the Kiwi pair jostles with the 200-DMA hurdle after posting a bullish candlestick on the daily chart, namely the Dragonfly Doji.
Not only the upbeat candlestick formation but the oversold RSI (14) also suggests the NZD/USD pair’s upside past the immediate hurdle surrounding 0.6170.
The same highlights a downward-sloping resistance line from early February, around 0.6205 at the latest.
Following that, the 61.8% and 50% Fibonacci retracement levels of the pair’s run-up from late November 2022 to early February 2023, near 0.6245 and 0.6300 respectively, could challenge the NZD/USD buyers.
It’s worth noting that the previous support line from November 17, close to 0.6330 by the press time, acts as the last defense of the Kiwi bears.
Alternatively, a daily closing below the multi-day bottom marked on Monday, around 0.6130, will defy the bullish candlestick and can direct the NZD/USD sellers towards the mid-November swing low surrounding 0.6060.
It should, however, be observed that the Kiwi pair’s weakness past 0.6060 appears tough as multiple supports stand tall to challenge the sellers around the 0.6000 psychological manget.
Trend: Limited recovery expected
Technical Levels: Supports and Resistances
NZDUSD currently trading at 0.6165 at the time of writing. Pair opened at 0.6165 and is trading with a change of 0.00% % .
| Overview | Overview.1 | |
|---|---|---|
| 0 | Today last price | 0.6165 |
| 1 | Today Daily Change | 0.0000 |
| 2 | Today Daily Change % | 0.00% |
| 3 | Today daily open | 0.6165 |
The pair remains strongly bearish on the daily time frame. It trades below the 20 SMA @ 0.6318, 50 SMA 0.6348, 100 SMA @ 0.6186 and 200 SMA @ 0.6184.
| Trends | Trends.1 | |
|---|---|---|
| 0 | Daily SMA20 | 0.6318 |
| 1 | Daily SMA50 | 0.6348 |
| 2 | Daily SMA100 | 0.6186 |
| 3 | Daily SMA200 | 0.6184 |
The previous day high was 0.6252 while the previous day low was 0.6151. The daily 38.2% Fib levels comes at 0.619, expected to provide resistance. Similarly, the daily 61.8% fib level is at 0.6214, expected to provide resistance.
Note the levels of interest below:
- Pivot support is noted at 0.6127, 0.6089, 0.6026
- Pivot resistance is noted at 0.6227, 0.629, 0.6328
| Levels | Levels.1 |
|---|---|
| Previous Daily High | 0.6252 |
| Previous Daily Low | 0.6151 |
| Previous Weekly High | 0.6263 |
| Previous Weekly Low | 0.6151 |
| Previous Monthly High | 0.6531 |
| Previous Monthly Low | 0.6190 |
| Daily Fibonacci 38.2% | 0.6190 |
| Daily Fibonacci 61.8% | 0.6214 |
| Daily Pivot Point S1 | 0.6127 |
| Daily Pivot Point S2 | 0.6089 |
| Daily Pivot Point S3 | 0.6026 |
| Daily Pivot Point R1 | 0.6227 |
| Daily Pivot Point R2 | 0.6290 |
| Daily Pivot Point R3 | 0.6328 |
[/s2If]
Join Our Telegram Group
")


