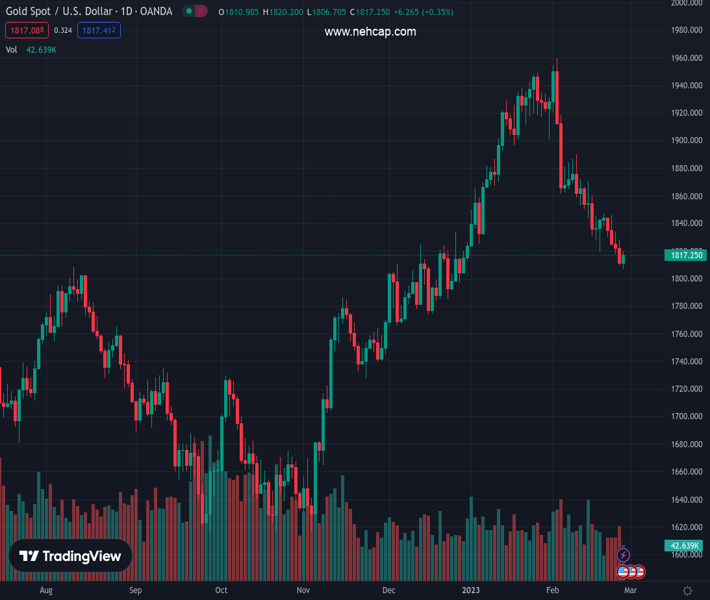
#XAUUSD @ 1,817.20 Gold price struggles with one-week-old previous support after snapping five-day downtrend on week-start., @nehcap view: Limited recovery expected (Pivot Orderbook analysis)
…
This is a premium post.
[s2If !current_user_can(access_s2member_level4)]Please register for PREMIUM VERSION HERE to read full post below containing analysis. In case of any error or you think you are not able to read the full post below, please email us at support#nehcap.com [lwa][/s2If] [s2If current_user_can(access_s2member_level4)]
- Gold price struggles with one-week-old previous support after snapping five-day downtrend on week-start.
- Mixed United States data, month-end positioning allow XAU/USD bears to take a breather.
- Hawkish Federal Reserve (Fed) concerns, overall US Dollar strength amid geopolitical fears, higher rate expectations probe Gold buyers.
The pair currently trades last at 1817.20.
The previous day high was 1827.87 while the previous day low was 1808.99. The daily 38.2% Fib levels comes at 1816.2, expected to provide support. Similarly, the daily 61.8% fib level is at 1820.66, expected to provide resistance.
Gold price (XAU/USD) struggles to defend the week-start rebound around $1,817, flirting with a short-term technical resistance, as the metal traders await more clues amid month-end positioning. That said, the bullion buyers cheered a pullback in the United States Treasury bond yields and the US Dollar to portray an upbeat Monday despite looming geopolitical fears and the hawkish bias of the Federal Reserve (Fed) officials. The reason could be linked to the mixed US data and month-end moves.
On Monday, the United States Treasury bond yields paused a multi-week-old upward trajectory amid mixed US data and the market’s wait for stronger clues to confirm the hawkish Federal Reserve (Fed) bias.
That said, US Durable Goods Orders slumped -4.5% in January versus -4.0% expected and 5.1% prior. However, the Nondefense Capital Goods Orders ex Aircraft grew 0.8% versus 0.0% analysts’ expectations and -0.3% previous readings. On the same line, the US Pending Home Sales rallied 8.0% MoM versus 1.0% expected and 1.1% prior.
The data triggered the much-needed pullback in the US Treasury bond yields as the benchmark 10-year coupon dropped three basis points (bps) to 3.92% after a five-week uptrend while the two-year counterpart followed the suit by retreating from a three-month high to 4.78%.
Mixed United States data and a pullback in the Treasury bond yields seem to fail in conveying the market’s fears surrounding the Ukraine-Russia war, especially after China’s dual show of having ties with Russia and flaunting a 12-point peace place for Ukraine. On Monday, US National Security Advisor Jake Sullivan said on CNN’s “State of the Union,” China’s stance on the Russian invasion of Ukraine puts it in an “awkward” position internationally and any weapons support to Russia would come with “real costs.”
Elsewhere, Federal Reserve Governor Philip Jefferson said on Monday that it is important to get back to 2% inflation to allow those sorts of sustained economic gains.
US Dollar traces the retreat in the US Treasury bond yields and a month-end positioning to allow the US Dollar bulls to take a breather. It should be noted that the Wall Street benchmarks closed with mild gains but failed to impress the US Dollar traders.
That said, the US Dollar Index (DXY) snapped a four-day uptrend to retreat from the seven-week high, to 104.65 by the press time. The DXY pullback allowed the Gold price to print 0.35% intraday gains as it pokes the $1,820 hurdle.
Moving on, second-tier United States economics, like the Conference Board’s Consumer Confidence and some activity numbers from Chicago and Richmond Fed, could entertain the Gold traders. However, major attention will be given to the qualitative catalysts.
Gold price broke a four-day-old descending resistance line, now support around $1,809, to portray the first daily gain in six. The recovery moves currently jostle with a one-week-long support-turned-resistance of around $1,820.
Given the bullish signals from the Moving Average Convergence and Divergence (MACD) indicator and the upbeat but not overbought Relative Strength Index (RSI) line, placed at 14, the XAU/USD is likely to extend the latest rebound past the $1,820 hurdle.
However, a convergence of the 100-Hour Moving Average (HMA) and the aforementioned bearish channel’s upper line, close to $1,831, appears the key for the Gold buyers to cross before retaking control.
Alternatively, the downside break of the immediate resistance-turned-support line near $1,809 could quickly drag Gold price towards the $1,800 threshold.
Following that, the bearish channel’s bottom line, close to $1,790 at the latest, can challenge the XAU/USD bears.
Overall, Gold is likely to pare recent losses but the overall trend remains bearish.
Trend: Limited recovery expected
Technical Levels: Supports and Resistances
XAUUSD currently trading at 1817.11 at the time of writing. Pair opened at 1810.94 and is trading with a change of 0.34% % .
| Overview | Overview.1 | |
|---|---|---|
| 0 | Today last price | 1817.11 |
| 1 | Today Daily Change | 6.17 |
| 2 | Today Daily Change % | 0.34% |
| 3 | Today daily open | 1810.94 |
The pair is trading below its 20 Daily moving average @ 1864.16, below its 50 Daily moving average @ 1865.35 , above its 100 Daily moving average @ 1792.35 and above its 200 Daily moving average @ 1776.01
| Trends | Trends.1 | |
|---|---|---|
| 0 | Daily SMA20 | 1864.16 |
| 1 | Daily SMA50 | 1865.35 |
| 2 | Daily SMA100 | 1792.35 |
| 3 | Daily SMA200 | 1776.01 |
The previous day high was 1827.87 while the previous day low was 1808.99. The daily 38.2% Fib levels comes at 1816.2, expected to provide support. Similarly, the daily 61.8% fib level is at 1820.66, expected to provide resistance.
Note the levels of interest below:
- Pivot support is noted at 1804.0, 1797.05, 1785.12
- Pivot resistance is noted at 1822.88, 1834.81, 1841.76
| Levels | Levels.1 |
|---|---|
| Previous Daily High | 1827.87 |
| Previous Daily Low | 1808.99 |
| Previous Weekly High | 1847.59 |
| Previous Weekly Low | 1808.99 |
| Previous Monthly High | 1949.27 |
| Previous Monthly Low | 1823.76 |
| Daily Fibonacci 38.2% | 1816.20 |
| Daily Fibonacci 61.8% | 1820.66 |
| Daily Pivot Point S1 | 1804.00 |
| Daily Pivot Point S2 | 1797.05 |
| Daily Pivot Point S3 | 1785.12 |
| Daily Pivot Point R1 | 1822.88 |
| Daily Pivot Point R2 | 1834.81 |
| Daily Pivot Point R3 | 1841.76 |
[/s2If]
Join Our Telegram Group
")


