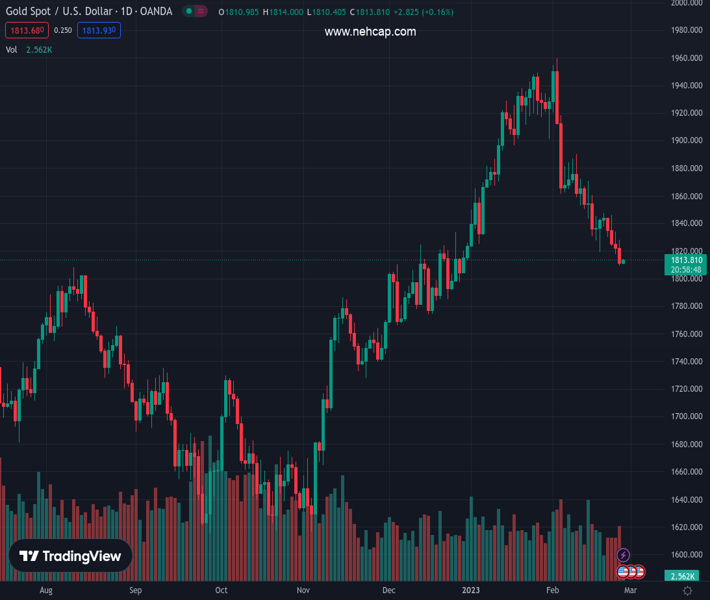
#XAUUSD @ 1,813.63 Gold price is expected to continue its four-day losing streak amid hawkish Fed bets. (Pivot Orderbook analysis)
…
This is a premium post.
[s2If !current_user_can(access_s2member_level4)]Please register for PREMIUM VERSION HERE to read full post below containing analysis. In case of any error or you think you are not able to read the full post below, please email us at support#nehcap.com [lwa][/s2If] [s2If current_user_can(access_s2member_level4)]
- Gold price is expected to continue its four-day losing streak amid hawkish Fed bets.
- Investors should be prepared for a surprise rise in US Durable Goods Orders as the households’ demand has accelerated lately.
- Gold price is trading in a Falling Channel chart pattern in which every pullback is considered a selling opportunity.
The pair currently trades last at 1813.63.
The previous day high was 1827.87 while the previous day low was 1808.99. The daily 38.2% Fib levels comes at 1816.2, expected to provide resistance. Similarly, the daily 61.8% fib level is at 1820.66, expected to provide resistance.
Gold price (XAU/USD) is demonstrating a topsy-turvy auction around $1,810.00 in the Asian session. The precious metal is expected to continue its four-day losing streak after surrendering the immediate support of $1,809.00 as Federal Reserve (Fed) policymakers see interest rates above 5% after January’s hot inflation data..
Cleveland Fed Bank President Loretta Mester cited “Will need to go above 5% funds rate, stay there for a while.” He further added, “Data shows inflation not yet on trend to get back sustainably to 2% target.”
An escalation in the United States Personal Consumption Expenditure (PCE) price index by 0.6% in January has cleared that it would be early announcing victory for the battle against inflation. A strong labor cost index has propelled consumer spending, which could result in a recovery in the Producer Price Index (PPI) ahead.
The US Dollar Index (DXY) is struggling to continue the upside move toward the 105.00 resistance. S&P500 futures are showing nominal gains after a bearish Friday, portraying a sheer drop in the risk appetite of the market participants. The return delivered on 10-year US Treasury bonds has dropped marginally below 3.94%.
Going forward, the Gold price will display action post the release of the US Durable Goods Orders (Jan) data. The street is expecting a contraction of 4% lower than the expansion of 5.6% released earlier. Investors should be prepared for a surprise rise as the households’ demand has accelerated lately.
Gold price is trading in a Falling Channel chart pattern in which every pullback is considered as a selling opportunity before a reversal move. The yellow metal is expected to find resistance around $1,820.00 after a minor pullback move.
The 50-period Exponential Moving Average (EMA) at $1,833.80 is acting as a major barricade for the Gold bulls.
The Relative Strength Index (RSI) (14) is oscillating in the bearish range of 20.00-40.00, which advocates further downside.
Technical Levels: Supports and Resistances
XAUUSD currently trading at 1813.36 at the time of writing. Pair opened at 1810.94 and is trading with a change of 0.13 % .
| Overview | Overview.1 | |
|---|---|---|
| 0 | Today last price | 1813.36 |
| 1 | Today Daily Change | 2.42 |
| 2 | Today Daily Change % | 0.13 |
| 3 | Today daily open | 1810.94 |
The pair is trading below its 20 Daily moving average @ 1864.16, below its 50 Daily moving average @ 1865.35 , above its 100 Daily moving average @ 1792.35 and above its 200 Daily moving average @ 1776.01
| Trends | Trends.1 | |
|---|---|---|
| 0 | Daily SMA20 | 1864.16 |
| 1 | Daily SMA50 | 1865.35 |
| 2 | Daily SMA100 | 1792.35 |
| 3 | Daily SMA200 | 1776.01 |
The previous day high was 1827.87 while the previous day low was 1808.99. The daily 38.2% Fib levels comes at 1816.2, expected to provide resistance. Similarly, the daily 61.8% fib level is at 1820.66, expected to provide resistance.
Note the levels of interest below:
- Pivot support is noted at 1804.0, 1797.05, 1785.12
- Pivot resistance is noted at 1822.88, 1834.81, 1841.76
| Levels | Levels.1 |
|---|---|
| Previous Daily High | 1827.87 |
| Previous Daily Low | 1808.99 |
| Previous Weekly High | 1847.59 |
| Previous Weekly Low | 1808.99 |
| Previous Monthly High | 1949.27 |
| Previous Monthly Low | 1823.76 |
| Daily Fibonacci 38.2% | 1816.20 |
| Daily Fibonacci 61.8% | 1820.66 |
| Daily Pivot Point S1 | 1804.00 |
| Daily Pivot Point S2 | 1797.05 |
| Daily Pivot Point S3 | 1785.12 |
| Daily Pivot Point R1 | 1822.88 |
| Daily Pivot Point R2 | 1834.81 |
| Daily Pivot Point R3 | 1841.76 |
[/s2If]
Join Our Telegram Group
")


